exam questions

Exam 70-778 All Questions

View all questions & answers for the 70-778 exam

Exam 70-778 topic 1 question 7 discussion

Actual exam question from Microsoft's 70-778
Question #: 7
Topic #: 1
[All 70-778 Questions]

You plan to embed multiple visualizations in a public website.
Your Power BI infrastructure contains the visualizations configured as shown in the following table.

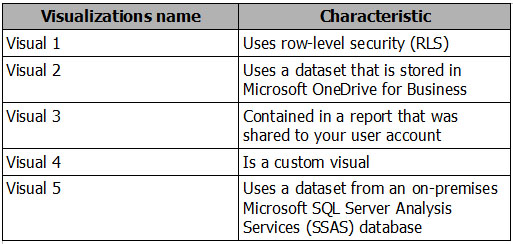
Which two visualizations can you embed into the website? Each correct answer presents a complete solution.
NOTE: Each correct selection is worth one point.

  • A. Visual 1
  • B. Visual 2
  • C. Visual 3
  • D. Visual 4
  • E. Visual 5
Show Suggested Answer Hide Answer
Suggested Answer: BD 🗳️
References:
https://docs.microsoft.com/en-us/power-bi/service-publish-to-web

Comments

Chosen Answer:
This is a voting comment (?). It is better to Upvote an existing comment if you don't have anything to add.
Switch to a voting comment New
mohroshdy
Highly Voted 5 years, 7 months ago
Correct answers Not all reports can be published to the web, unsupported scenarios as: 1- R visuals 2- Reports with row-level security (RLS) -> (Visual 1) 3- Reports that connect live to on-premises Analysis Services Tabular (Visual 5) 4- Reports shared with you -> (Visual 3)
upvoted 45 times
...
JackZhang
Highly Voted 5 years, 3 months ago
Limitations Publish to web is supported for the vast majority of data sources and reports in the Power BI service, however, the following are not currently supported or available with Publish to web: Reports using row level security. Reports using any Live Connection data source, including Analysis Services Tabular hosted on-premises, Analysis Services Multidimensional, and Azure Analysis Services. Reports using a shared dataset, which is stored in a different workspace from the report. Reports shared to you directly or through an organizational content pack. Reports in a group in which you are not an edit member. "R" Visuals are not currently supported in Publish to web reports. Exporting Data from visuals in a report, which has been published to the web. ArcGIS Maps for Power BI visuals. Reports containing report-level DAX measures. Single sign-on data query models. Secure confidential or proprietary information. Shared and certified datasets. The automatic authentication capability provided with the Embed option doesn't work with the Power BI JavaScript API. For the Power BI JavaScript API, use the user owns data approach to embedding.
upvoted 9 times
...
Community vote distribution
A (35%)
C (25%)
B (20%)
Other
Most Voted
A voting comment increases the vote count for the chosen answer by one.

Upvoting a comment with a selected answer will also increase the vote count towards that answer by one. So if you see a comment that you already agree with, you can upvote it instead of posting a new comment.

SaveCancel
Loading ...