exam questions

Exam 70-762 All Questions

View all questions & answers for the 70-762 exam

Exam 70-762 topic 1 question 51 discussion

Actual exam question from Microsoft's 70-762
Question #: 51
Topic #: 1
[All 70-762 Questions]

Note: This question is part of a series of questions that use the same or similar answer choices. An Answer choice may be correct for more than one question in the series. Each question independent of the other questions in this series. Information and details provided in a question apply only to that question.
You are a database developer for a company. The company has a server that has multiple physical disks. The disks are not part of a RAID array. The server hosts three Microsoft SQL Server instances. There are many SQL jobs that run during off-peak hours.
You must monitor the SQL Server instances in real time and optimize the server to maximize throughput, response time, and overall SQL performance.
You need to ensure that the performance of each instance is consistent for the same queried and query plans.
What should you do?
  • A. A. Create a sys.dm_os_waiting_tasks query.
  • B. Create a sys.dm_exec_sessions query.
  • C. Create a Performance Monitor Data Collector Set.
  • D. Create a sys.dm_os_memory_objects query.
  • E. Create a sp_configure "˜max server memory' query.
  • F. Create a SQL Profiler trace.
  • G. Create asys.dm_os_wait_stats query.
  • H. Create an Extended Event.
Show Suggested Answer Hide Answer
Suggested Answer: H 🗳️
Advanced Viewing of Target Data from Extended Events in SQL Server
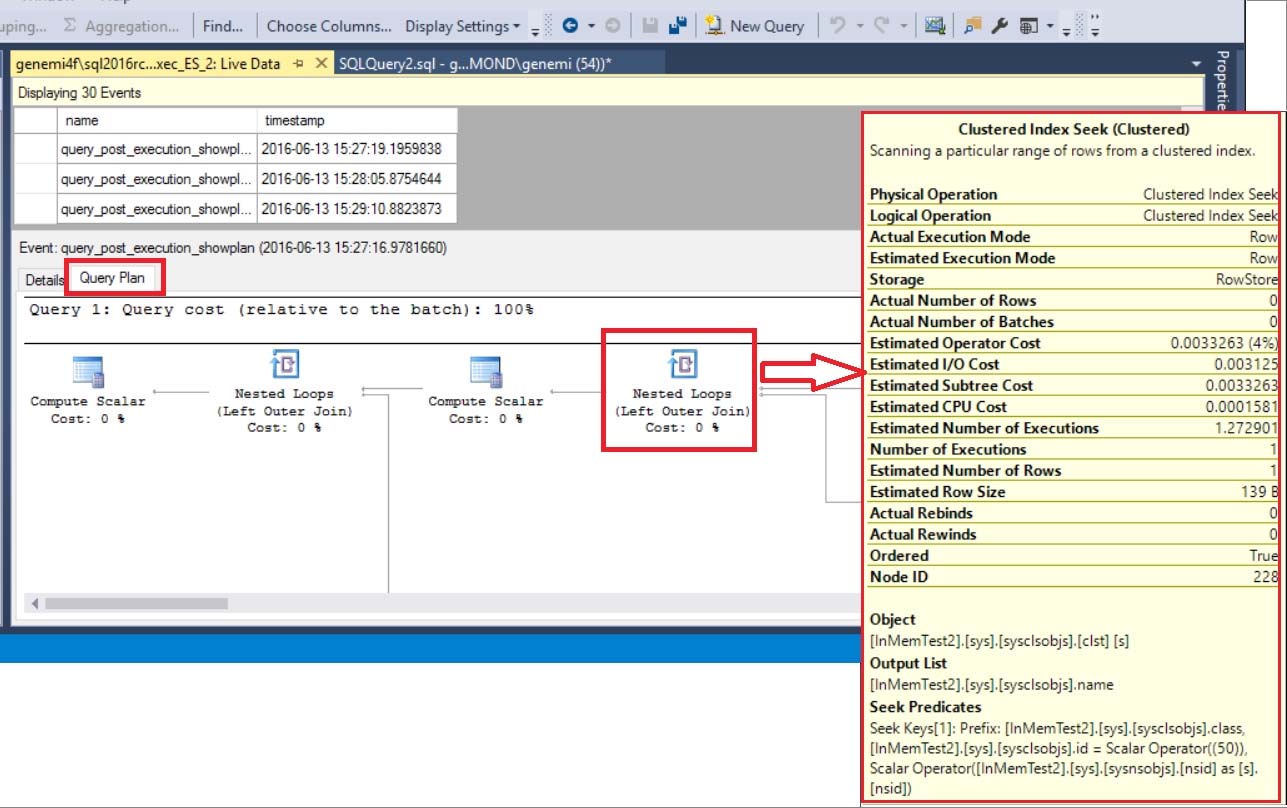
When your event session is currently active, you might want to watch the event data in real time, as it is received by the target.
Management > Extended Events > Sessions > [your-session] > Watch Live Data.
The query_post_execution_showplan extended event enables you to see the actual query plan in the SQL Server Management Studio (SSMS) UI. When the
Details pane is visible, you can see a graph of the query plan on the Query Plan tab. By hovering over a node on the query plan, you cansee a list of property names and their values for the node.

References:
https://msdn.microsoft.com/en-us/library/mt752502.aspx

Comments

Chosen Answer:
This is a voting comment (?). It is better to Upvote an existing comment if you don't have anything to add.
Switch to a voting comment New
SzalonyZielonyRobak
Highly Voted 5 years, 4 months ago
H. Create an Extended Event. The difference is that in question 50 you were asked about general performance metrics. Here you need to look at multiple servers and check actual Query Plan and make sure that is works quite similar on every server.
upvoted 8 times
...
414
Most Recent 5 years, 5 months ago
I think C is correct.
upvoted 2 times
JohnFan
5 years, 4 months ago
Management > Extended Events > Sessions > [your-session] > Watch Live Data. The query_post_execution_showplan extended event enables you to see the actual query plan in the SQL Server Management Studio (SSMS) UI. When the Details pane is visible, you can see a graph of the query plan on the Query Plan tab. By hovering over a node on the query plan, you cansee a list of property names and their values for the node.
upvoted 1 times
...
Nelly100
5 years, 3 months ago
You are Wrong. Correct answer is H
upvoted 3 times
...
...
Community vote distribution
A (35%)
C (25%)
B (20%)
Other
Most Voted
A voting comment increases the vote count for the chosen answer by one.

Upvoting a comment with a selected answer will also increase the vote count towards that answer by one. So if you see a comment that you already agree with, you can upvote it instead of posting a new comment.

SaveCancel
Loading ...