The diagram below depicts an auditor's estimated maximum deviation rate compared with the tolerable rate, and also depicts the true population deviation rate compared with the tolerable rate. As a result of tests of controls, the auditor assesses control risk too low and thereby decreases substantive testing. This is illustrated by situation: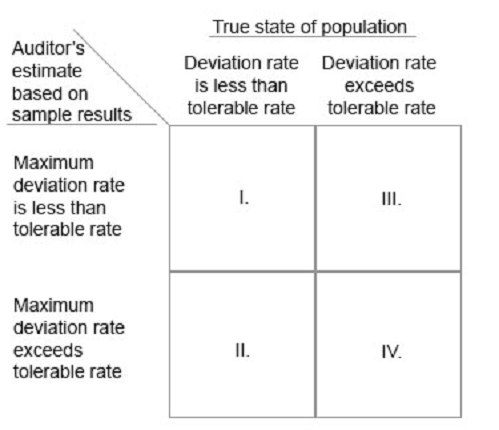

Comments