C. Capability of enterprise to implement
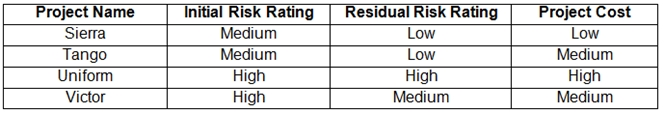
The chart shows the Initial Risk Rating, Residual Risk, and Project Cost for four different projects. The difference between the Initial and Residual Risk ratings can give an idea about the effectiveness of the risk treatment measures, while the Project Cost can give some insight into the financial resources required for each project.
Therefore, this chart primarily helps in understanding the capability of the enterprise to implement these projects based on the risk and cost factors. It does not show multiple risk factors addressed by a chosen response (A), does not indicate their relative positions on a risk map (B), nor does it detail specific risk treatment options (D).
Heat map is related to Probability and impact.
Given answer is correct.
upvoted 1 times
...
...
This section is not available anymore. Please use the main Exam Page.CRISC Exam Questions
Log in to ExamTopics
Sign in:
Community vote distribution
A (35%)
C (25%)
B (20%)
Other
Most Voted
A voting comment increases the vote count for the chosen answer by one.
Upvoting a comment with a selected answer will also increase the vote count towards that answer by one.
So if you see a comment that you already agree with, you can upvote it instead of posting a new comment.

01010100
10 months agoCbtL
1 year, 3 months agojohn_boogieman
1 year, 6 months agoRaj1510
2 years, 6 months agotsangckl
2 years, 3 months ago