exam questions

Exam 70-778 All Questions

View all questions & answers for the 70-778 exam

Exam 70-778 topic 1 question 29 discussion

Actual exam question from Microsoft's 70-778
Question #: 29
Topic #: 1
[All 70-778 Questions]

You have a table named Sales that contains sales data for the United States. A sample of the data in Sales is shown in the following table.

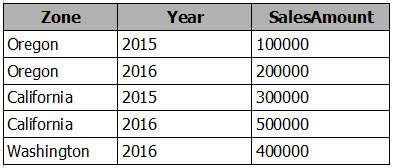
When you attempt to create a map that shows SalesAmount by Zone, you discover that the map shows a bubble based on cities instead of states.
You need to ensure that the map shows bubbles based on states.
What should you do?

  • A. Add a column named Country that contains United States as the value.
  • B. Add a column for longitude and a column for latitude.
  • C. Select the Zone field. From the Modeling tab, change the Data Category.
  • D. Select the Zone field. From the Modeling tab, change the Data Type.
Show Suggested Answer Hide Answer
Suggested Answer: C 🗳️
References:
https://docs.microsoft.com/en-us/power-bi/guided-learning/visualizations#step-5

Comments

Chosen Answer:
This is a voting comment (?). It is better to Upvote an existing comment if you don't have anything to add.
Switch to a voting comment New
kilowd
Highly Voted 5 years, 3 months ago
This is a common problem when the data in your location field is ambiguous, such as using an area name like Washington, which could indicate a state or a district. One way to resolve the location data problem is to rename your column to be more specific, such as State. Another way is to manually reset the data category by selecting Data Category on the Modeling tab. From the Data Category list, you can assign a category to your data such as "State" or "City."
upvoted 16 times
...
Satyapn9
Highly Voted 4 years, 10 months ago
Answer C is correct
upvoted 5 times
...
CDL
Most Recent 4 years, 7 months ago
C is correct https://docs.microsoft.com/en-us/learn/modules/visuals-in-power-bi/5-map-visualizations
upvoted 1 times
...
kimalto452
4 years, 9 months ago
In updated power bi the option appear in "Column tools" not in Modeling
upvoted 3 times
...
Community vote distribution
A (35%)
C (25%)
B (20%)
Other
Most Voted
A voting comment increases the vote count for the chosen answer by one.

Upvoting a comment with a selected answer will also increase the vote count towards that answer by one. So if you see a comment that you already agree with, you can upvote it instead of posting a new comment.

SaveCancel
Loading ...