DRAG DROP -
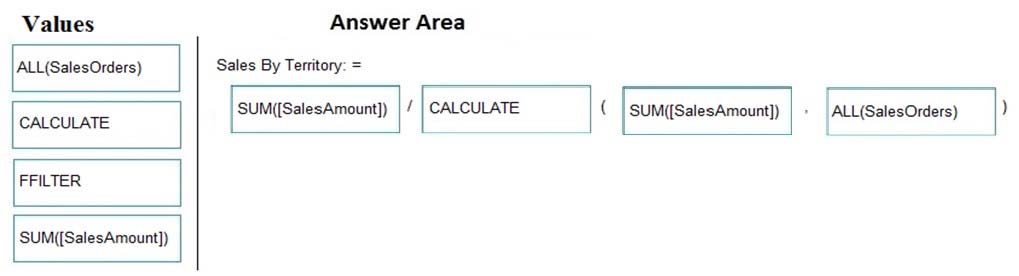
You have a data model that contains a table named SalesOrders. SalesOrders has four columns named OrderId, SalesAmount, OrderDate, and Territory.
You plan to create a PivotChart that will display the percentage of SalesAmount for each Territory.
You need to create a measure to calculate the percentage of sales of each territory.
How should you complete the DAX formula? To answer, drag the appropriate values to the correct targets. Each value may be used once, more than once, or not at all. You may need to drag the split bar between panes or scroll to view content.
NOTE: Each correct selection is worth one point.
Select and Place: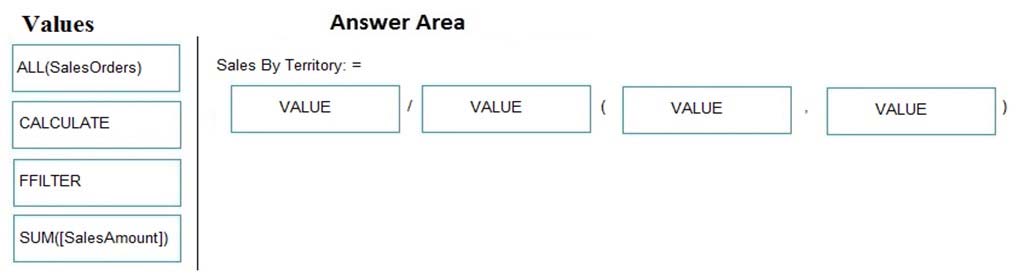

CDL
4 years, 9 months agoBobJenkins
5 years, 5 months agontonthat
5 years, 5 months ago