HOTSPOT -
You are analyzing the asymmetry in a statistical distribution.
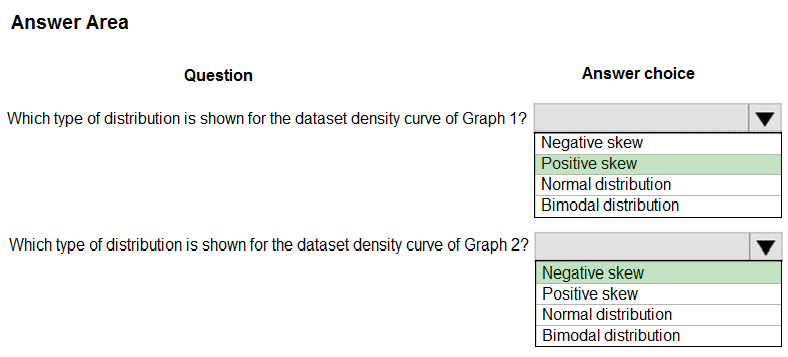
The following image contains two density curves that show the probability distribution of two datasets.
Use the drop-down menus to select the answer choice that answers each question based on the information presented in the graphic.
NOTE: Each correct selection is worth one point.
Hot Area: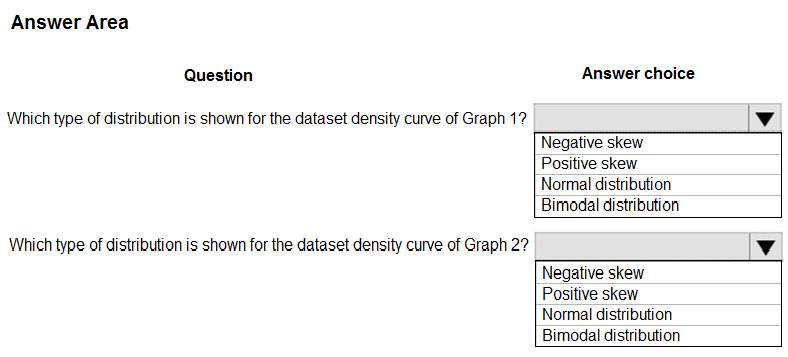

VickyM
Highly Voted 4 years, 1 month agoZhuo
Highly Voted 4 years, 1 month agoInversaRadice
Most Recent 6 months, 1 week agojames2033
8 months, 2 weeks agoPeeking
1 year, 3 months agophdykd
1 year, 3 months agoNormanDS
2 years, 7 months agosaurabhk1
3 years, 3 months agoShankar_102
3 years, 4 months agodeepakconsult
3 years, 9 months agoNugi
3 years, 10 months agoRajuuu
3 years, 10 months agopepmir
3 years, 12 months agojsnels86
4 years agoajithvajrala
4 years agoJames_James
4 years, 1 month agoWTT
4 years, 1 month ago