DRAG DROP -
You have a model that contains the following table named Sales.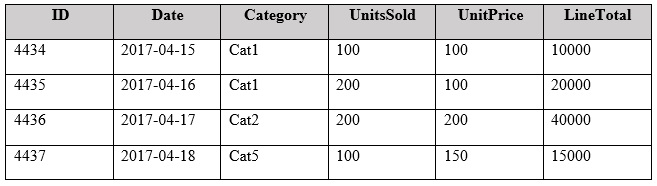
You have a measure named TotalSales that calculates the sum of LineTotal.
You plan to create a PivotChart to display TotalSales for each category and the percent of total sales for each category as shown in the following exhibit.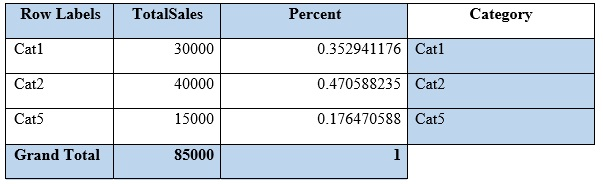
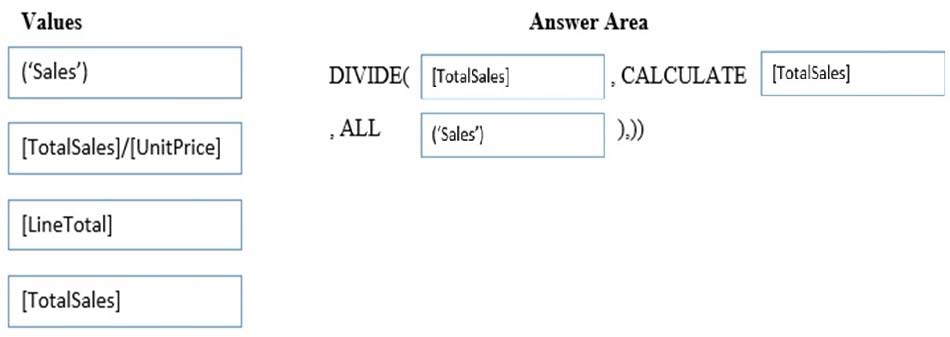
How should you complete the DAX formula for the Percent measure? To answer, drag the appropriate fields to the correct areas. Each field may be used once, more than once, or not at all. You may need to drag the split bar between panes or scroll to view content.
NOTE: Each correct selection is worth one point.
Select and Place: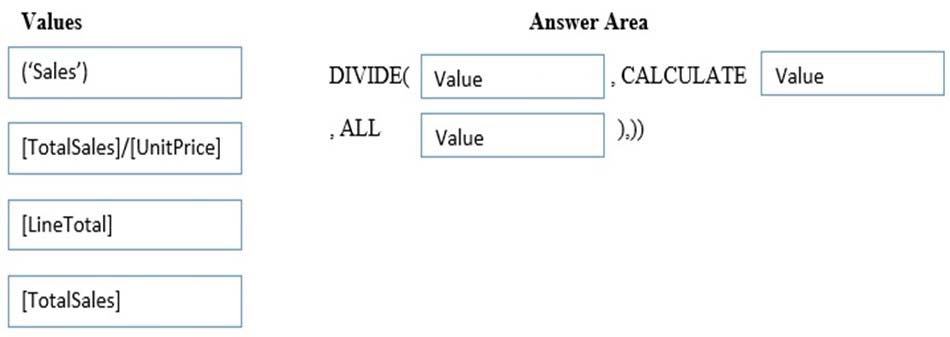

lyniguez
Highly Voted 4 years, 9 months agoFrdFrd
4 years, 5 months agokannn
Most Recent 4 years, 7 months agoCDL
4 years, 8 months agoTzozo
4 years, 10 months agohfgirona
4 years, 7 months ago