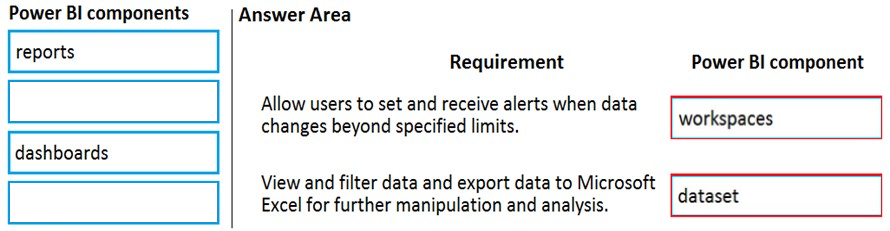
DRAG DROP -
A company plans to implement Power BI to analyze retail operations data.
You need to recommend solutions for the company.
Which Power BI components should the company use? To answer, drag the appropriate Power BI components to the correct requirements. Each Power BI component may be used once, more than once, or not at all. You may need to drag the split bar between panes or scroll to view content.
NOTE: Each correct selection is worth one point.
Select and Place: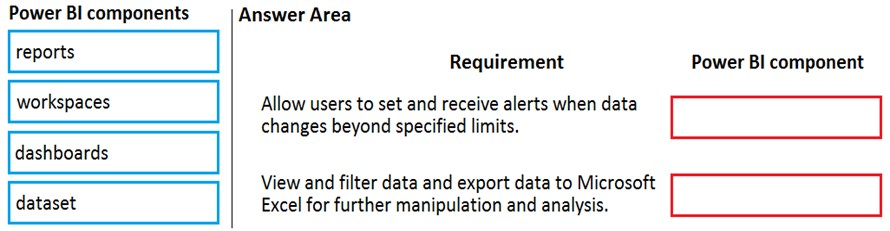

beerus
Highly Voted 5 years, 1 month agoladywhiteadder
3 years, 4 months agobeerus
Highly Voted 5 years, 1 month agoZakriya
4 years, 3 months agoGupta_Harshit
4 years, 3 months agoGupta_Harshit
4 years, 3 months agomadyjoe21
4 years, 2 months agoShier28
2 years, 4 months agogrvsh
Most Recent 2 months, 2 weeks agogrvsh
3 months agoZarima
1 year, 3 months agoCachave
1 year, 8 months agodelpiero
1 year, 8 months agoPhil12345
2 years, 1 month agoAKATTHULA
2 years, 1 month agoziggy1117
2 years, 2 months agokty
2 years, 3 months agogloby118
2 years, 3 months agomak595
2 years, 5 months agoFreddyKruger1
7 months, 3 weeks agoiamSophie
2 years, 5 months agoEdrisKazemi
2 years, 6 months agoEltooth
2 years, 7 months agoTAPASHI
2 years, 8 months ago