exam questions

Exam 70-778 All Questions

View all questions & answers for the 70-778 exam

Exam 70-778 topic 1 question 91 discussion

Actual exam question from Microsoft's 70-778
Question #: 91
Topic #: 1
[All 70-778 Questions]

You are creating a report in Power BI Desktop that has two visualizations on a page as shown in the following exhibit.

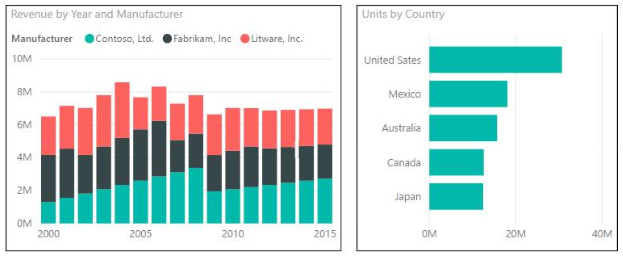
You need to ensure that when you click the bar of a country, only the values for that country are shown on the Revenue by Year and Manufacturer chart.

  • A. Click the Revenue by Year and Manufacturer chart. On the Format tab, click Edit Interactions. On the Units by Country chart, click Filter.
  • B. Click the Revenue by Year and Manufacturer chart. On the Format tab, click Edit Interactions. On the Units by Country chart, click Highlight.
  • C. Click the Units by Country chart. On the Format tab, click Edit Interactions. On the Revenue by Year and Manufacturer chart, click Filter.
  • D. Click the Units by Country chart. On the Format tab, click Edit Interactions. On the Revenue by Year and Manufacturer chart, click Highlight.
Show Suggested Answer Hide Answer
Suggested Answer: C 🗳️
References:
https://docs.microsoft.com/en-us/power-bi/service-reports-visual-interactions

Comments

Chosen Answer:
This is a voting comment (?). It is better to Upvote an existing comment if you don't have anything to add.
Switch to a voting comment New
pbia
Highly Voted 4 years, 9 months ago
Watch this will help to understand fast https://youtu.be/N_xYsCbyHPw
upvoted 13 times
...
Community vote distribution
A (35%)
C (25%)
B (20%)
Other
Most Voted
A voting comment increases the vote count for the chosen answer by one.

Upvoting a comment with a selected answer will also increase the vote count towards that answer by one. So if you see a comment that you already agree with, you can upvote it instead of posting a new comment.

SaveCancel
Loading ...
exam
Someone Bought Contributor Access for:
SY0-701
London, 1 minute ago