From the Home tab in Power BI Desktop, you click Enter Data and create a table named Sales that contains the following data.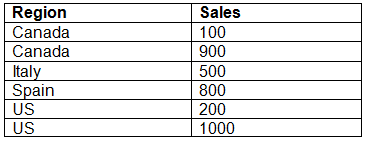
You add Region and Sales to visualization and the visualization displays the following data.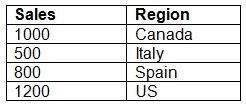
What causes the visualization to display four rows of data instead of six?

SteveKarr
Highly Voted 5 years, 11 months agoRoryHny
5 years, 11 months agoHien
5 years, 10 months agoSaeedJei
3 years, 8 months agokyliek7
4 years, 7 months agoFrdFrd
4 years, 5 months agotwane
Highly Voted 5 years, 9 months agoVermonster
5 years, 5 months agoMange
5 years agokyliek7
4 years, 7 months agoHemantsahu11
Most Recent 1 year, 11 months agodzeri
4 years agoLhouss
4 years, 6 months agoMar_tin
4 years, 7 months agoCDL
4 years, 7 months agokirin5190
4 years, 6 months agoVi1125
4 years, 8 months agoeug45
4 years, 10 months agoeug45
4 years, 9 months agoeug45
4 years, 9 months agoshahatul
4 years, 10 months agoFenloh
4 years, 11 months agopbia
4 years, 11 months agoEchicken69
5 years agoamature
5 years, 1 month agoSamuelZhang
5 years, 1 month agosumitmalik
5 years, 1 month agoOutsider
5 years, 1 month ago