Note: This question is part of a series of questions that use the same scenario. For your convenience, the scenario is repeated in each question. Each question presents a different goal and answer choices, but the text of the scenario is the same in each question in this series.
You have a Microsoft SQL Server database that contains the following tables.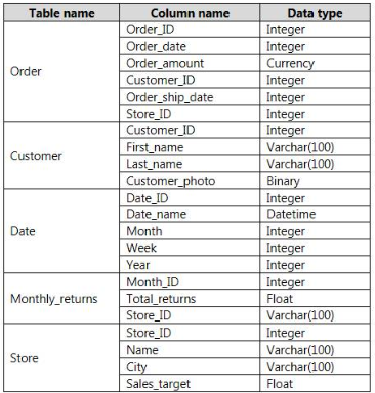
The following columns contain date information:
✑ Date[Month] in the mmyyyy format
✑ Date[Date_ID] in the ddmmyyyy format
✑ Date[Date_name] in the mm/dd/yyyy format
✑ Monthly_returns[Month_ID] in the mmyyyy format
The Order table contains more than one million rows.
The Store table has a relationship to the Monthly_returns table on the Store_ID column. This is the only relationship between the tables.
You plan to use Power BI Desktop to create an analytics solution for the data.
You plan to create a chart that displays total Order[Order_amount] by Store[Name].
You need to modify the model to ensure that you can create the chart.
Which two actions should you perform? Each correct answer presents part of the solution.
NOTE: Each correct selection is worth one point.

shubhamgupta
Highly Voted 5 years, 11 months agoRBY10
5 years, 9 months agoMo2011
4 years, 10 months agoArklur
5 years, 8 months agoJohnFan
5 years, 6 months agoJohnFan
5 years, 6 months agoGraceZ
4 years, 3 months agomohroshdy
Highly Voted 5 years, 6 months agoLhouss
Most Recent 4 years, 7 months agokyliek7
4 years, 7 months agoFLA
4 years, 8 months agoVi1125
4 years, 8 months agosjonghe
4 years, 8 months agolilyzhang
4 years, 10 months agoIkay81
4 years, 11 months agoGIO200011
4 years, 9 months agoRJM9000
4 years, 11 months agoJ55889
4 years, 11 months ago07071996
5 years, 1 month agoelonmusk
5 years, 1 month agoIsmMira
5 years, 4 months agolozqt
5 years, 4 months agoDelta
5 years, 6 months agomohroshdy
5 years, 5 months agosaw
5 years, 4 months agoRutzb
5 years, 6 months agoprokocim
5 years, 2 months agok3rz0rg
5 years, 7 months ago