exam questions

Exam 70-778 All Questions

View all questions & answers for the 70-778 exam

Exam 70-778 topic 1 question 94 discussion

Actual exam question from Microsoft's 70-778
Question #: 94
Topic #: 1
[All 70-778 Questions]

Note: This question is part of a series of questions that use the same scenario. For your convenience, the scenario is repeated in each question. Each question presents a different goal and answer choices, but the text of the scenario is the same in each question in this series.
You have a Microsoft SQL Server database that contains the following tables.

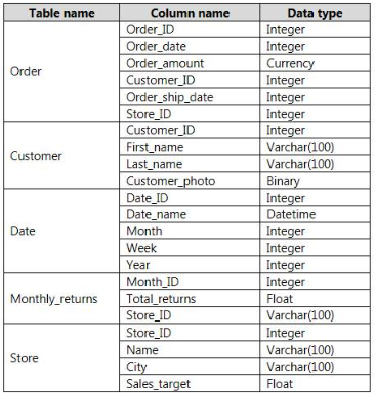
The following columns contain date information:
✑ Date[Month] in the mmyyyy format
✑ Date[Date_ID] in the ddmmyyyy format
✑ Date[Date_name] in the mm/dd/yyyy format
✑ Monthly_returns[Month_ID] in the mmyyyy format
The Order table contains more than one million rows.
The Store table has a relationship to the Monthly_returns table on the Store_ID column. This is the only relationship between the tables.
You plan to use Power BI Desktop to create an analytics solution for the data.
You need to create a chart that displays a sum of Order[Order_amount] by month for the Order_ship_date column and the Order_date column.
How should you model the data?

  • A. Create a one-to-many relationship from Date[Date_ID] to Order[Order_date] and another relationship from Date[Date_ID] to Monthly_returns[Date_ID].
  • B. Add a second Date table named Ship_date to the model. Create a many-to-many relationship from Date[Date_ID] to Order[Order_date] and many-to-many relationship from Ship_date[Date_ID] to Order[Order_ship_date].
  • C. Add a second Date table named Ship_date to the model. Create a one-to-many relationship from Date[Date_ID] to Order[Order_date] and a one-to-many relationship from Ship_Date[Date_ID] to Order[Order_ship_date].
  • D. Create a one-to-many relationship from Date[Date_ID] to Order[Order_date] and another relationship from Date[Date_ID] to Order[Order_ship_date].
Show Suggested Answer Hide Answer
Suggested Answer: C 🗳️

Comments

Chosen Answer:
This is a voting comment (?). It is better to Upvote an existing comment if you don't have anything to add.
Switch to a voting comment New
Orl
Highly Voted 5 years, 11 months ago
Anybody else thinks that right answer is D?
upvoted 15 times
SteveKarr
5 years, 11 months ago
Option D as-is would not work. In case of D, the second relationship would have to be makred inactive and DAX would have to use USERELATIONSHIP function.
upvoted 6 times
Hien
5 years, 10 months ago
Yes, I agree.
upvoted 2 times
...
AnetaK
5 years, 7 months ago
Is it forbidden?
upvoted 1 times
...
p_eloy
4 years, 11 months ago
You are right, but the question point is about model. It doesn't even mention a possible scenario that you use a specific dax function, i guess.
upvoted 2 times
...
...
Brunobsv
5 years, 7 months ago
There's no need to create two relationships between the same tables. It rarely does.
upvoted 3 times
...
FrdFrd
4 years, 5 months ago
D is the definitely the correct answer. Data must be modeled that way. Modeling like C suggests is neither a good practice nor will it allow the desired chart to be created, as there would be two different time dimensions, one for OrderData and another for ShipDate, which we wouldn't be able to combine in the X-Axis. If data is modeled as D suggests the chart would be feasible by simply creating with DAX a measure that uses the inactive relationship to the date table.
upvoted 2 times
...
...
Gonza967
Highly Voted 5 years, 6 months ago
The answer is D. Even tho connecting two tables with two relationships would render one of them "inactive", it's possible to activate it via DAX with "userelationship()". Think of it this way, if you were dealing with big database, you would like to minimise the amount of data and leverage the already exiting one as much as possible, thus creating more than one relationship with the same table if possible and avoid duplicating it. This very example is explained in depth in the following video: https://www.youtube.com/watch?v=sONvctPlplY
upvoted 8 times
...
Mar_tin
Most Recent 4 years, 7 months ago
Based on the following research C & D is right with favor for D https://docs.microsoft.com/en-us/power-bi/guidance/relationships-active-inactive Even Microsoft recommends the usage of active relationships wherever possible they seems to use exactly the same example like in examtopics task 9 to show that you also can do it the D way with inactive relationships if you do not need a silmultaneously filtering of the dimension roles (order_ship_date column and the Order_date column) Would be interessting to know which exact downsites this will have for e.g. Q&A functionality
upvoted 1 times
Mar_tin
4 years, 7 months ago
I mean examtopics task 94
upvoted 1 times
...
...
CDL
4 years, 7 months ago
should be D, active and InActive relationship.
upvoted 1 times
...
Martin_Nbg
4 years, 9 months ago
Imagine building the report page with option C and you want a table or column chart with month / sales ordered / sales shipped. Which month field would you pick: from first date table or from second date table? None would work. No, no, D must be the correct answer.
upvoted 1 times
...
Tobi999
4 years, 9 months ago
This Question is also part of the DA-100 Exam!
upvoted 2 times
...
tinknerd
4 years, 10 months ago
C is correct very sneaky D says Create a one-to-many relationship from Date[Date_ID] to Order[Order_date] and another INACTIVE relationship from Date[Date_ID] to Order[Order_ship_date]. Inactive is missing --no two active relationships
upvoted 1 times
7Zet
4 years, 8 months ago
You can create 2 relationships. One will become inactive by default. You don't need to manually deactivate it.
upvoted 1 times
...
...
RJM9000
4 years, 11 months ago
Are you serious with C solution? It is totally wrong: A) We don't have any information about the chance to create a ship_Date_id; B) It is so heavy, while we can simply use USER RELATIONSHIP dax function! So the answer is D.
upvoted 1 times
...
pbia
4 years, 11 months ago
If you use two date table then which table should we use in axis (month). So we are not allowed to create two date table. SO answer is D
upvoted 1 times
...
PowerLjubica
5 years ago
Definitely D!
upvoted 1 times
...
Agustin
5 years ago
Solution C is totally wrong as there is no Ship_Date[Date_ID] table-column combination.
upvoted 3 times
...
07071996
5 years, 1 month ago
I'll go with C. D will work but the part about creating an inactive /active relation is not mentioned. SO, the given solution is incomplete
upvoted 1 times
...
Rathish
5 years, 1 month ago
Is that possible to create a chart with two dates from same table? As I understood, this is the limitation of creating separate date tables like order date or ship date, in order to overcome this, we have to create multiple relationships from same table and use USERELATIONSHIP to make the relationship active for the particular context. Also, the question talks about modeling, there is no right/wrong, all model can work some way, but is it good idea to create a separate table for one visual? Share your thoughts.
upvoted 1 times
...
Dontpanice
5 years, 4 months ago
Since you will end up with an inactive connection using D it is not the correct answer. Nowhere is "USERELATIONSHIP" mentioned in the text either so I don't know what everyone else is talking about. The only option that works is C, make a new table create active relationships, one to many.
upvoted 1 times
RutRut
5 years, 4 months ago
D is correct. That allows you to use Month column from Date table in a chart. In C, there is no way to create a chart, that displays one Month field for two measures.
upvoted 9 times
...
...
raspberry
5 years, 4 months ago
I vote for D. The question is how you would MODEL the data. The question is NOT what is needed to make the chart. Modelling the data is about creating relationships.
upvoted 1 times
...
mohroshdy
5 years, 6 months ago
D is the correct answer Use USERELATIONSHIP function for Ship Date, this is the easiest way
upvoted 1 times
...
JohnFan
5 years, 6 months ago
You need to create a chart that displays a sum of Order[Order_amount] by month for the Order_ship_date column and the Order_date column. It requires use "the Order_ship_date column" and "the Order_date column" to displays a sum of Order[Order_amount] by month. As the data types of these two columns are integers, they must have relationship with Date table. Solution 1: Create a one-to-many relationship from Date[Date_ID] to Order[Order_date] and another one-to-many relationship from Date[Date_ID] to Order[Order_ship_date]. In this case, only one can be active, and the other has to use USERELATIONSHIP to get month. Solution 2: Add a second Date table named Ship_date to the model. Create a one-to-many relationship from Date[Date_ID] to Order[Order_date] and a one-to-many relationship from Ship_Date[Date_ID] to Order[Order_ship_date]. In this case, two columns use different date table to get month.
upvoted 6 times
saw
5 years, 4 months ago
With solution 2, which date column you would use in the chart ? you can't use both dates in the same chart, right?
upvoted 4 times
...
...
Community vote distribution
A (35%)
C (25%)
B (20%)
Other
Most Voted
A voting comment increases the vote count for the chosen answer by one.

Upvoting a comment with a selected answer will also increase the vote count towards that answer by one. So if you see a comment that you already agree with, you can upvote it instead of posting a new comment.

SaveCancel
Loading ...