DRAG DROP -
You have a property named FactInternetSales used by several Power BI reports. The query is shown in the exhibit. (Click the Exhibit button.)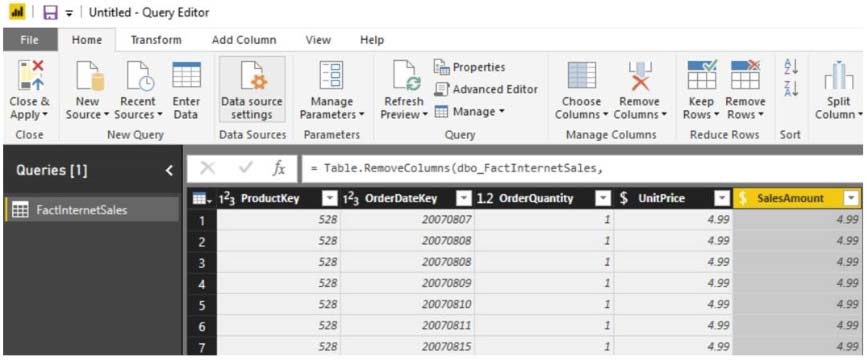
You plan to create a bar chart showing the count of sales by year that have a SalesAmount greater than $1,000.
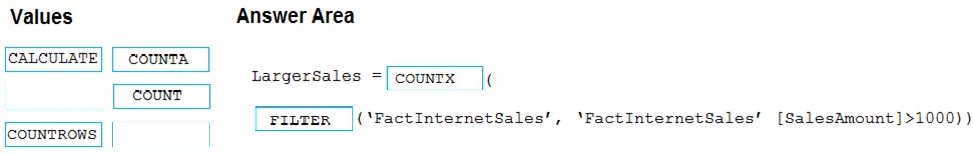
You need to create a measure that will be used in the bar chart.
How should you complete the DAX formula? To answer, drag the appropriate values to the correct targets. Each value may be used once, more than once, or not at all. You may need to drag the split bar between panes or scroll to view content.
Select and Place: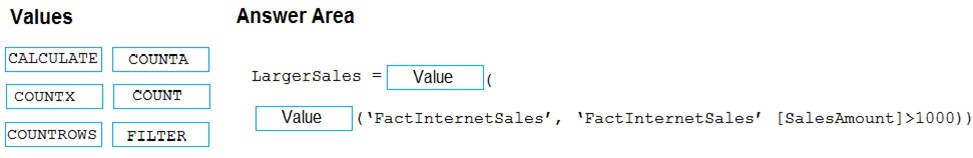

Orl
Highly Voted 5 years, 11 months agoHien
5 years, 10 months agomirzotti
5 years, 7 months agoJohnFan
5 years, 6 months agotwane
Highly Voted 5 years, 9 months agoJohnFan
5 years, 6 months agoVermonster
5 years, 5 months agoSam25
5 years, 1 month agowifaq
5 years agoaa_1984
Most Recent 3 months, 3 weeks agonemanjaandic
4 years, 4 months agoLhouss
4 years, 6 months agothaodo
4 years, 7 months agoCDL
4 years, 7 months agoitsmahouch
4 years, 8 months agokyliek7
4 years, 7 months agokyliek7
4 years, 7 months agoFakherThabti
4 years, 9 months agoSebedu
4 years, 11 months agoOnkar26
5 years agoMange
5 years agoMange
5 years agorainbowstuf
5 years agoShanrb
5 years, 1 month agoclaudia_learner
5 years, 1 month agoJony
5 years, 3 months agoOld_Fun
5 years, 3 months agoStanjaak
5 years, 3 months ago