exam questions

Exam 70-778 All Questions

View all questions & answers for the 70-778 exam

Exam 70-778 topic 1 question 116 discussion

Actual exam question from Microsoft's 70-778
Question #: 116
Topic #: 1
[All 70-778 Questions]

You have a Power BI Desktop project that has the model shown in the exhibit. (Click the Exhibit tab.)

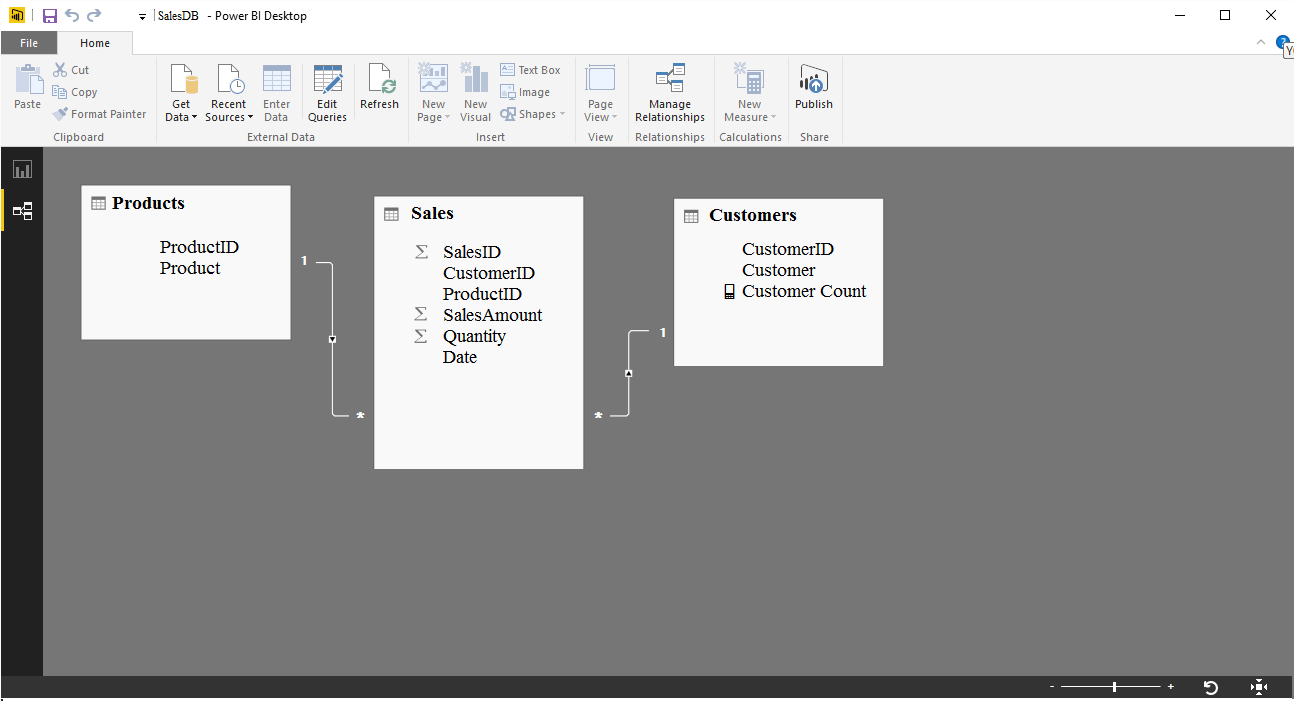
Customer Count is a measure that uses the CountRows function to calculate the number of customers.
You create a table visualization that displays ProductID, Product, and Customer Count.
When you view the table, you discover that Customer Count always displays the total number of customers instead of the number of customers who purchased the product.
You need to ensure that the table visualization displays the number of customers who purchased each product.
What should you do?

  • A. Modify the table relationship between the Customers table and the Sales table to use a Cross filter direction of Both.
  • B. Modify the Customer Count measure to use the COUNT function.
  • C. Modify the Customer Count measure to use the COUNTX function.
  • D. Modify the table relationship between the Products table and the Sales table to use a Cross filter direction of Both.
Show Suggested Answer Hide Answer
Suggested Answer: D 🗳️
References:
https://docs.microsoft.com/en-us/power-bi/desktop-create-and-manage-relationships

Comments

Chosen Answer:
This is a voting comment (?). It is better to Upvote an existing comment if you don't have anything to add.
Switch to a voting comment New
SteveKarr
Highly Voted 5 years, 11 months ago
Answer should be A Similar example here - https://radacad.com/what-is-the-direction-of-relationship-in-power-bi
upvoted 40 times
...
Hien
Highly Voted 5 years, 10 months ago
I agree the answer should be A.
upvoted 11 times
...
nemanjaandic
Most Recent 4 years, 4 months ago
At first glance thought it was D, but after testing the answer is A. We need to modify relationship between Customers and Sales table.
upvoted 1 times
...
Lhouss
4 years, 6 months ago
Should be A.
upvoted 1 times
...
CDL
4 years, 7 months ago
wonderful example as below Link, Answer must be A. https://radacad.com/what-is-the-direction-of-relationship-in-power-bi
upvoted 1 times
...
Mar_tin
4 years, 7 months ago
Objective: The visualisation should display the number of customers who purchased each product Approach: 1. We need: Products[Product], [SalesAmount] & [Customer Count] 2. We need the following crossfilter direction: 'Products'->'Sales'->'Customers' Solution: A: We need to set the crossfilter between 'Sales' & 'Customers' to <-> both
upvoted 1 times
...
Vi1125
4 years, 8 months ago
Guys / gals I think the answer is D - I did this without reading anything additional - the filters from the Customer table where the measure is - isn't getting to the products table where the products and product ID are being used in the table view. This is because there is a many to one relationship between Sales to Product ID and the little arrow is going downwards - so how can 'Products' travel upwards to 'Sales' table and then 'Customers' it can't - hence this needs to be set to filter cross direction of both
upvoted 1 times
...
kiarraa
4 years, 8 months ago
The measure customer count is created in the Customers table. Which is why it is imp to add a direction path from product->sales->customers in order to ensure that the customers can be filtered by product. hence option A is correct
upvoted 1 times
...
Mo2011
4 years, 10 months ago
It should be A , I have just tested
upvoted 1 times
...
Nmak
4 years, 10 months ago
Answer should be A: I tried to create sample data into Power BI with 3 tables: Sales Sales Id Product ID Customer Id Quantity 1 1 1 10 2 1 2 10 3 1 3 10 4 2 1 5 5 3 2 15 6 3 1 10 Customer Customer ID Customer Name 1 Chang 2 Mack 3 John Product Product Id Product Name 1 Tang 2 Coke 3 Pepsi Now I created both direct join between sales and Product: Results are: Product Name Count of Customers Tang 3 Pepsi 3 Coke 3 Now I changed the Both directional join between sales and Customer. Results are: Product Name Count of Customers Tang 3 Pepsi 2 Coke 1
upvoted 1 times
...
vcyc
4 years, 11 months ago
Correct answer should be C- using COUNTX
upvoted 2 times
...
Echicken69
4 years, 12 months ago
So confused.... I read https://radacad.com/what-is-the-direction-of-relationship-in-power-bi and in the screenshot they provided it states that you should have a cross filter relationship between Sales and Product table to make the resolution work... why does the answer say you need that for the Customer and Sales table instead? Can someone please confirm this...seems it's either A or D atm...??
upvoted 1 times
...
Yip
5 years ago
has anyone noticed that the direction of relationship is incorrect in the diagram from Sales to Customers
upvoted 4 times
...
SamuelZhang
5 years, 1 month ago
okay, the easy way to remember is : make direction to 'both ' between the table in which the actual column you want to count and the intermediate table.
upvoted 1 times
...
Outsider
5 years, 1 month ago
D is the correct answer. Filters go to the 1 side to the Many side. So, Customer table applies filters to Sales Table and Product applies to the Sales. We need a both direction between Product and Sales otherwise fiters from Customer are not going to past
upvoted 1 times
...
avnish26
5 years, 2 months ago
Answer is A - Tested
upvoted 5 times
...
amar111
5 years, 2 months ago
LOT of people have written lot of comments . I would say better solve the problem on POWER BI desktop first and then write here .As I can see lot of incorrect information posted in comments . The Correct answer is A - change Cross Filter direction between sales and customer to BOTH
upvoted 8 times
...
Community vote distribution
A (35%)
C (25%)
B (20%)
Other
Most Voted
A voting comment increases the vote count for the chosen answer by one.

Upvoting a comment with a selected answer will also increase the vote count towards that answer by one. So if you see a comment that you already agree with, you can upvote it instead of posting a new comment.

SaveCancel
Loading ...