DRAG DROP -
A company plans to create an information portal that managers can use to view critical information about their teams.
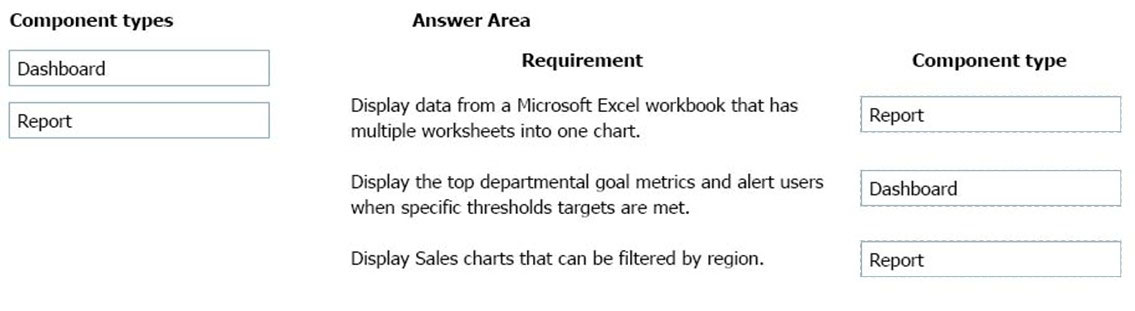
You need to recommend the type of Power BI components that the company should use.
What should you recommend? To answer, drag the appropriate component types to the correct requirements. Each component type may be used once, more than once, or not at all. You may need to drag the split bar between panes or scroll to view content.
NOTE. Each correct selection is worth one point.
Select and Place: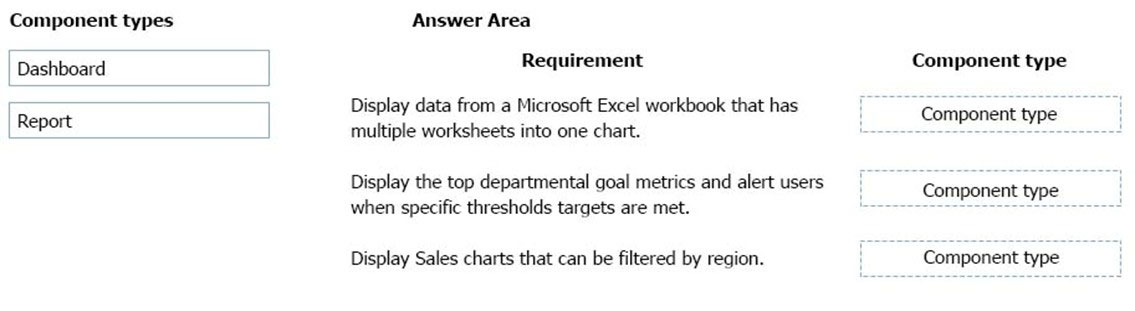

Qablan89
Highly Voted 4 years, 9 months agoAZ_Guru_Wannabe
Highly Voted 2 years, 4 months agohype23
Most Recent 1 year agogloby118
2 years, 2 months agoNasrzz
2 years, 1 month agoKolif
2 years, 2 months agoRampriya
2 years, 7 months agorituraj14271
3 years agoManiula
2 years, 1 month agoElderon
3 years, 1 month agoBitwiseLS
3 years, 1 month agoprash4pl200
3 years, 2 months agoDNC
2 years, 8 months agoEwoutBI
1 year, 11 months agojor_sa
3 years, 5 months agoSnow_28
3 years, 4 months agoPraveenGabriel
3 years, 8 months agoAunehwet79
3 years, 9 months agosaadnadir
4 years, 4 months agowhatefab
4 years, 6 months agoDevCitizen
4 years, 7 months ago