HOTSPOT -
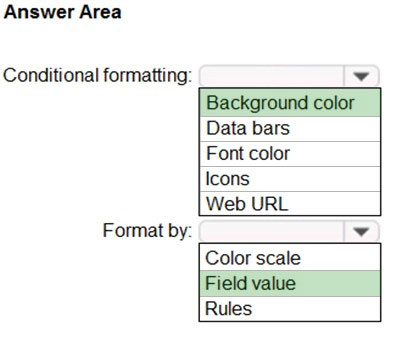
You need to create a visual as shown in the following exhibit.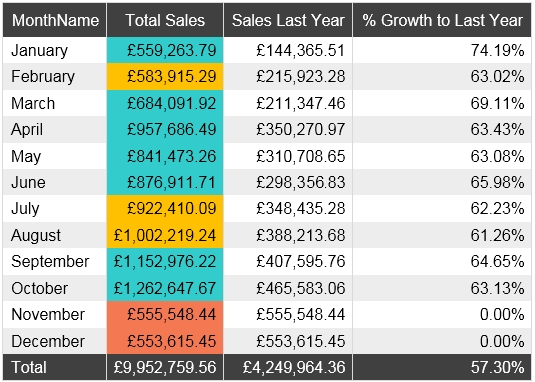
The indicator color for Total Sales will be based on % Growth to Last Year.
The solution must use the existing calculations only.
How should you configure the visual? To answer, select the appropriate options in the answer area.
NOTE: Each correct selection is worth one point.
Hot Area:

brieucboonen1
Highly Voted 4 years, 5 months agocufta05
3 years, 9 months agoZakriya
4 years, 3 months agoPiiri565
4 years, 5 months agoMatreshka
3 years, 2 months agoadbukavu
3 years, 8 months agoSoh_b
3 years, 7 months agomanlynn
4 years, 4 months agoGeorgerak
4 years, 4 months agokens09n
4 years, 1 month agokens09n
4 years, 1 month agoVM_GCP
Highly Voted 4 years, 5 months agoMichcat
Most Recent 2 years, 2 months agoAibloy
3 years, 1 month agoTomasz1989
3 years, 2 months agoBhushan_M
3 years, 2 months agoNS1992
3 years, 2 months agozps55051
3 years, 4 months agow0mz
3 years, 4 months agoelainesoh123
3 years, 4 months agoAshley090521
3 years, 5 months agoJames_8341
3 years, 5 months agoMeyti
3 years, 7 months agoShan
3 years, 7 months agokwanalytics
3 years, 7 months agokblee
3 years, 7 months agoFuulhouse
3 years, 7 months agosemwaja
3 years, 9 months ago