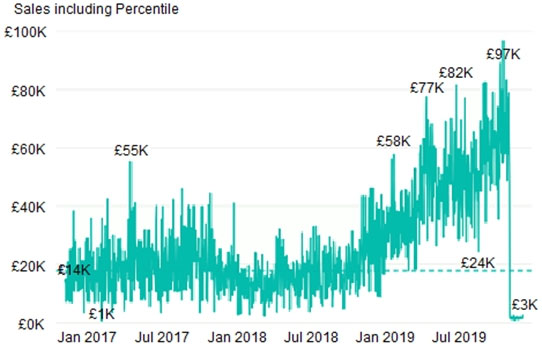
You plan to create the chart shown in the following exhibit. How should you create the dashed horizontal line denoting the 40th percentile of daily sales for the period shown?
A.
Add a measure to the visual that uses the following DAX expression. Measure1 = PERCENTILEX.INC (Sales,Sales[Total Sales],0.40)
B.
Add a new percentile line that uses Total Sales as the measure and 40% as the percentile.
C.
Create a horizontal line that has a fixed value of 24,000.
D.
Add a measure to the visual that uses the following DAX expression. Measure1 = PERCENTILEX.EXC (Sales,Sales[Total Sales],0.40)
This section is not available anymore. Please use the main Exam Page.DA-100 Exam Questions
Log in to ExamTopics
Sign in:
Community vote distribution
A (35%)
C (25%)
B (20%)
Other
Most Voted
A voting comment increases the vote count for the chosen answer by one.
Upvoting a comment with a selected answer will also increase the vote count towards that answer by one.
So if you see a comment that you already agree with, you can upvote it instead of posting a new comment.

LPPPPP
Highly Voted 4 years, 3 months agoberserkguts
3 years, 11 months agoMassy
3 years, 11 months agoWenwentije
3 years, 8 months agoWORLD_PEACE_TURTLE
2 years, 10 months agovcyc
3 years agotanuchaudhary
Highly Voted 4 years, 3 months agobakamon
Most Recent 2 years agodmnantilla9
3 years, 1 month agoJordiJordi
3 years, 3 months agoAshley090521
3 years, 3 months agoBobPresh
3 years, 5 months agoShan
3 years, 5 months agoskmmmf
3 years, 5 months agokwanalytics
3 years, 5 months agoaguilartu1
3 years, 7 months agoimaaaa
3 years, 8 months agonowwin
3 years, 8 months agoIhueghian
3 years, 8 months agoUlrica
3 years, 9 months agofrancis6170
3 years, 10 months agoMaQya
3 years, 11 months agoAmmarGharaibeh
4 years ago