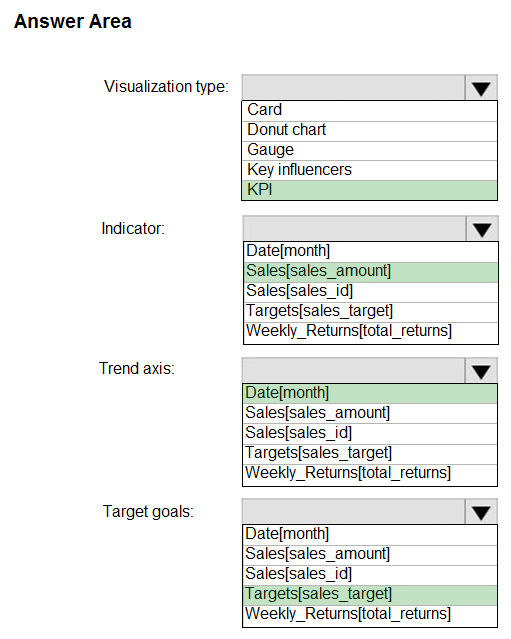
HOTSPOT -
You need to create a visualization to meet the reporting requirements of the sales managers.
How should you create the visualization? To answer, select the appropriate options in the answer area.
NOTE: Each correct selection is worth one point.
Hot Area: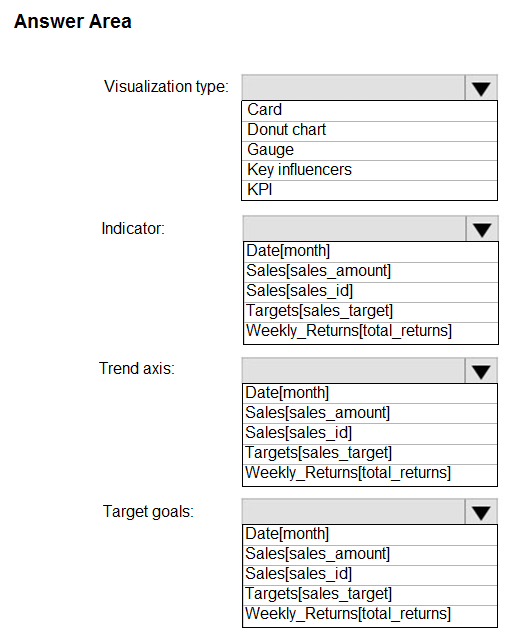

Rahul0222
Highly Voted 4 years, 4 months agoDeathCaliberKnight
Highly Voted 4 years, 3 months agoTechDiva
Most Recent 3 years, 4 months agoTechDiva
3 years, 4 months agojakup123
4 years, 2 months agogeky123
4 years agogeky123
4 years agomsh600
4 years, 2 months agojakup123
4 years, 2 months agoDaveLen
4 years, 3 months agoDaveLen
4 years, 3 months agosnnelo07
4 years, 2 months agoaclacl
4 years, 3 months agolyniguez
4 years, 4 months agoEllenW
4 years, 4 months ago