DRAG DROP -
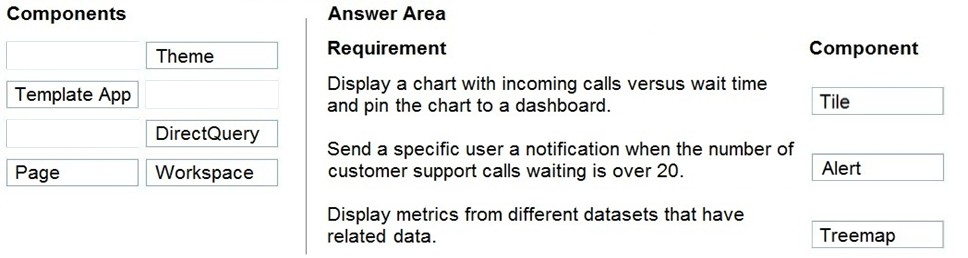
A company plans to display support call metrics on a screen that is visible to all call center staff.
You need to recommend solutions to meet the company's requirements.
What should you recommend? To answer, drag the appropriate components to the correct requirements. Each component may be used once, more than once, or not at all. You may need to drag the split bar between panes or scroll to view content.
NOTE: Each correct selection is worth one point.
Select and Place: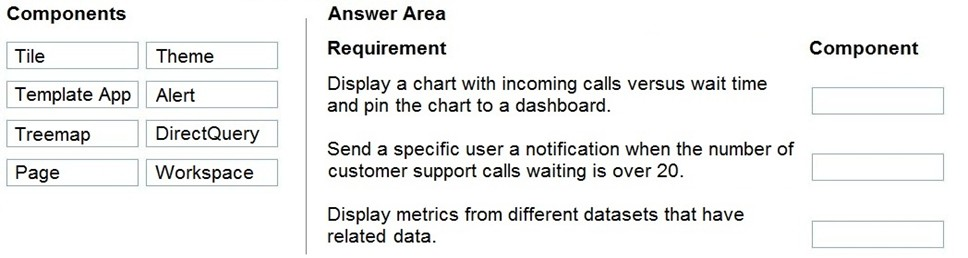

fiorellaps
Highly Voted 4 years, 2 months agoAmbitiousLearner
3 years, 6 months agofujifilm
2 years, 10 months agoFreddyKruger1
7 months, 2 weeks agoMHub
6 months, 2 weeks agomohankvs
4 years, 1 month agoJulieBee
4 years agomax_n
3 years, 11 months agohappy777
Highly Voted 3 years, 12 months agohype23
11 months, 3 weeks agohappy777
3 years, 12 months agoMHub
Most Recent 6 months, 2 weeks agohype23
11 months, 3 weeks agohype23
11 months, 3 weeks agoabe42
1 year, 1 month agohype23
11 months, 3 weeks agoMHub
6 months, 2 weeks agof81043f
1 year, 1 month agodciferit
1 year, 6 months agoRanaW
1 year, 10 months agoMurtuza
2 years, 1 month agoSHNH
2 years, 3 months agoAK_1234
2 years, 3 months agoEltooth
2 years, 7 months agoSelma97
2 years, 9 months agoLee_Tonida
3 years, 1 month agoAamir009
3 years, 5 months agoClaraM
2 years, 8 months agoSisb
3 years, 5 months agoJieda
3 years, 5 months ago