DRAG DROP -
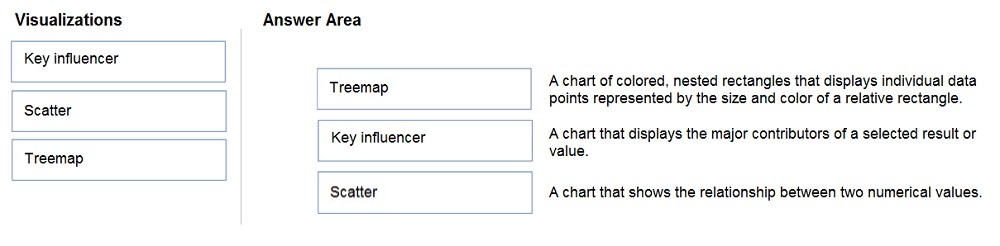
Match the types of visualizations to the appropriate descriptions.
To answer, drag the appropriate visualization type from the column on the left to its description on the right. Each visualization type may be used once, more than once, or not at all.
NOTE: Each correct match is worth one point.
Select and Place: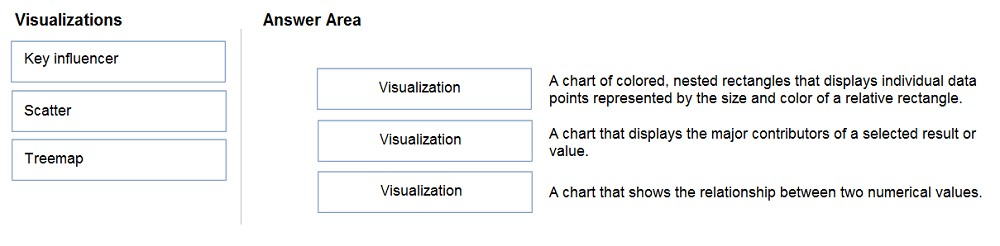

Crazy_Angel
Highly Voted 4 years, 1 month agoyeanlingmedal71
Highly Voted 4 years, 3 months agoAVP_Riga
4 years, 2 months agoman5484
Most Recent 9 months, 1 week agoAGTraining
1 year, 5 months agoakhil5432
2 years agomamahani
2 years, 4 months agochiiiweiii
2 years, 5 months agoJoanna0
2 years, 6 months agoDrchattss
3 years agoEltooth
3 years, 1 month agodk87
3 years, 3 months agomre
3 years, 4 months agoAZ5cert
3 years, 4 months agoShuwy
3 years, 5 months agoMoezey
3 years, 6 months agosumanshu
3 years, 6 months agoMjwc
3 years, 10 months ago