DRAG DROP -
You are modeling data in a table named SalesDetail by using Microsoft Power BI.
You need to provide end users with access to the summary statistics about the SalesDetail data. The users require insights on the completeness of the data and the value distributions.
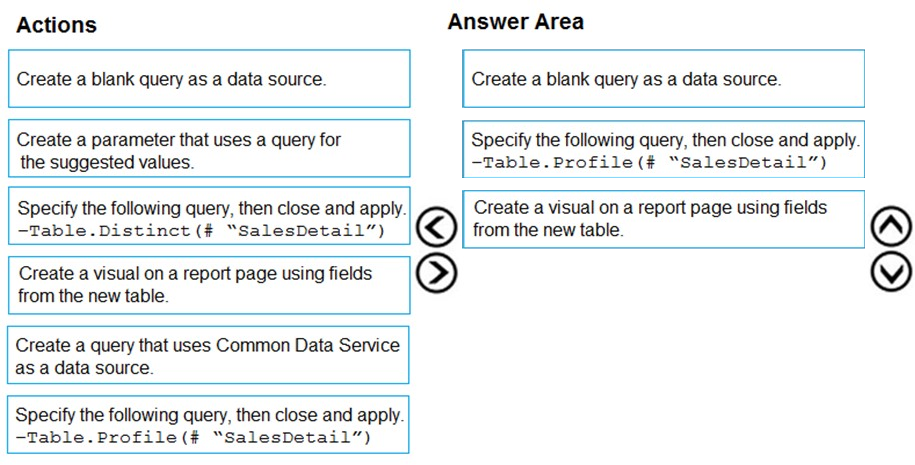
Which three actions should you perform in sequence? To answer, move the appropriate actions from the list of actions to the answer area and arrange them in the correct order,
Select and Place: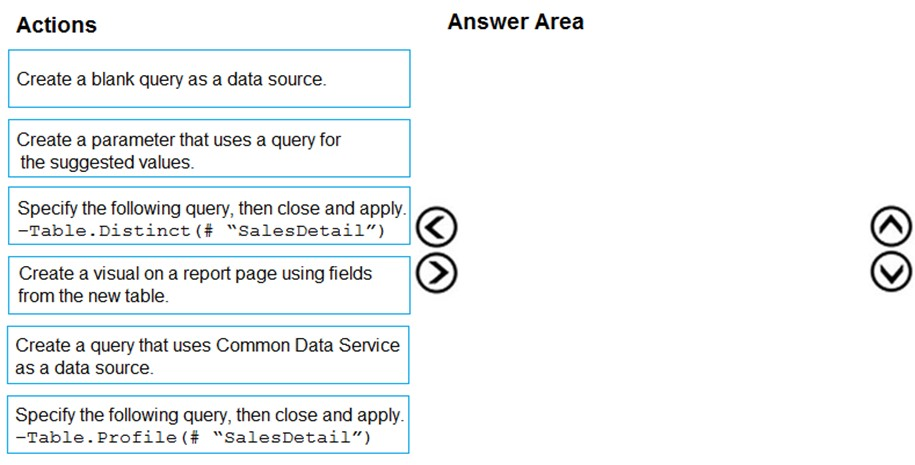

emi502
Highly Voted 4 years, 3 months agoemi502
4 years, 3 months agofhqhfhqh
Highly Voted 4 years, 2 months agoBhushan_M
Most Recent 3 years, 2 months agoStalin77
3 years, 11 months agofrancis6170
3 years, 11 months agoPopxm
4 years agoBhushan_M
3 years, 2 months agoL0L0_OLIMBO
4 years, 2 months agoDavid_Hu
4 years, 2 months agoJajcarz
4 years, 2 months agoMassy
4 years, 1 month ago