HOTSPOT -
You create a Power Platform help Desk solution.
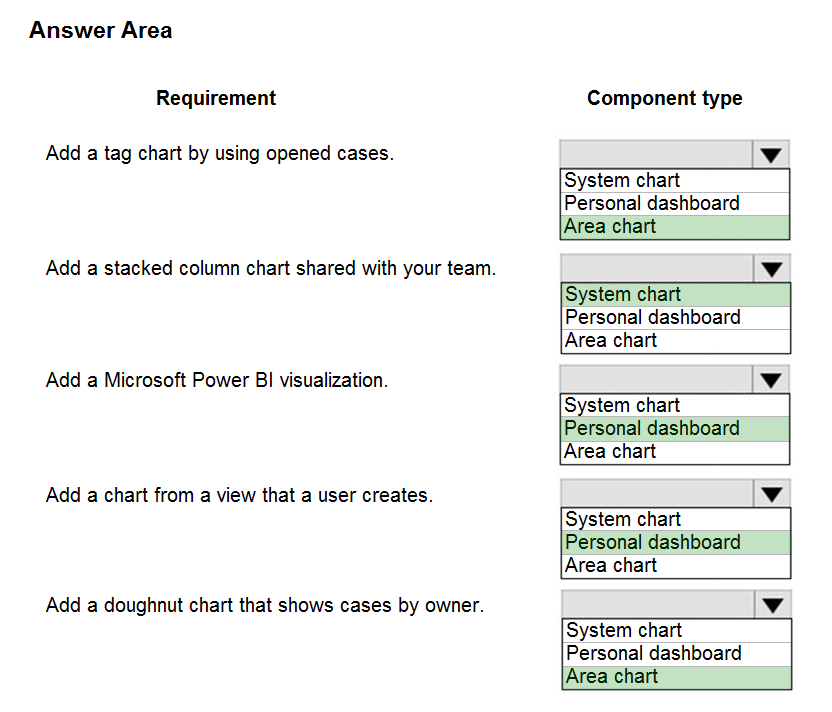
You need to create a dashboard that displays information on help desk cases that are handled each week.
Which dashboard components should you use? To answer, select the appropriate options in the answer area.
NOTE: Each correct selection is worth one point.
Hot Area: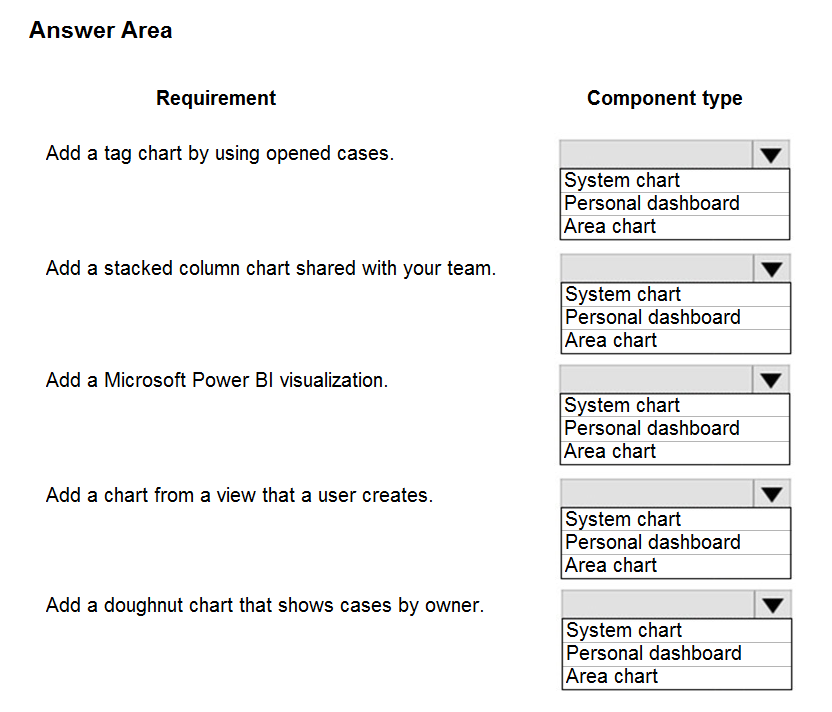

xoshi23
Highly Voted 3 years, 9 months agoiaur
3 years, 3 months agonikki_singla
Highly Voted 3 years, 9 months agoXiltroX
2 years, 10 months ago33a7f9e
Most Recent 8 months, 2 weeks agokillionb12
5 months, 3 weeks agoMrEz
1 year, 4 months agohismail
1 year, 6 months agoD365Apprentice
2 years agoD365Apprentice
2 years agocharles879987
2 years, 1 month agocharles879987
2 years, 1 month agoMrEz
1 year, 4 months agoIkhalil
2 years, 3 months agoDude_Seriously
2 years, 9 months agoMrEz
1 year, 4 months agoAdyK
2 years, 9 months agoSujadocs
2 years, 10 months agonish712
2 years, 10 months agolouieanderson
2 years, 11 months agoFyrus
3 years, 1 month agoD365Apprentice
2 years ago[Removed]
3 years, 1 month agonasty
3 years, 3 months agoNyanne
2 years, 10 months agosteffischmidt
3 years, 3 months ago