exam questions

Exam 70-779 All Questions

View all questions & answers for the 70-779 exam

Exam 70-779 topic 1 question 57 discussion

Actual exam question from Microsoft's 70-779
Question #: 57
Topic #: 1
[All 70-779 Questions]

You need to configure a PivotChart as shown in the following exhibit.

Which chart element should you enable?

  • A. Error Bars
  • B. Axis Titles
  • C. Data Table
  • D. Data Labels
Show Suggested Answer Hide Answer
Suggested Answer: B 🗳️
Reference:
https://www.tutorialspoint.com/excel_charts/excel_charts_elements.htm

Comments

Chosen Answer:
This is a voting comment (?). It is better to Upvote an existing comment if you don't have anything to add.
Switch to a voting comment New
imran
Highly Voted 5 years, 8 months ago
answer is D 100%
upvoted 7 times
imran
5 years, 8 months ago
sorry its Data Tables
upvoted 23 times
kannn
4 years, 7 months ago
its D. I tested it
upvoted 1 times
kannn
4 years, 7 months ago
Sorry i mean C. Data tables is correct
upvoted 3 times
...
...
...
...
mohroshdy
Highly Voted 5 years, 7 months ago
C. Data Table is the correct answer To show the totals below you have to enable Data Table
upvoted 7 times
...
iaaqq
Most Recent 4 years, 5 months ago
answer is D 100%
upvoted 1 times
...
Agustin
4 years, 12 months ago
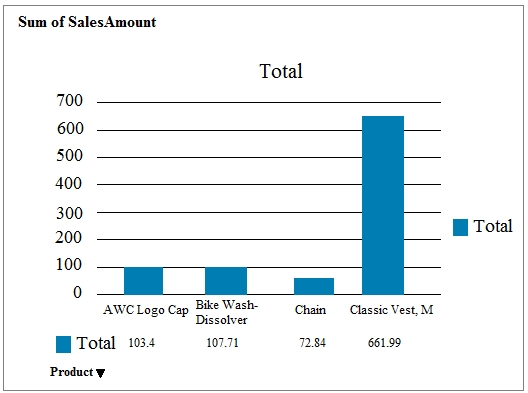
Tested. Answer is Data Table. In order to achieve the results from the example, you will then need to remove the borders from the Data Table. Answer is C 100%
upvoted 1 times
jason69
4 years, 5 months ago
Yes. Select Data Table with Legend Key. Then, remove all the borders.
upvoted 1 times
...
...
Vermonster
5 years, 3 months ago
C is correct - puts data below the axis
upvoted 4 times
...
SN22
5 years, 4 months ago
B is correct
upvoted 1 times
nose
5 years, 4 months ago
How can this be if Axis Title are added automatically? The onle chart element you can add is Data Table.... C is correct
upvoted 5 times
...
...
HiJaak
5 years, 8 months ago
Correct and CHECKED answer is "Data Table", and to obtain the exact image you have to select "More options" and uncheck the Table borders for Horizontal/Vertical/Outline and checked "Show legend keys"
upvoted 6 times
...
Community vote distribution
A (35%)
C (25%)
B (20%)
Other
Most Voted
A voting comment increases the vote count for the chosen answer by one.

Upvoting a comment with a selected answer will also increase the vote count towards that answer by one. So if you see a comment that you already agree with, you can upvote it instead of posting a new comment.

SaveCancel
Loading ...