Suggested Answer:
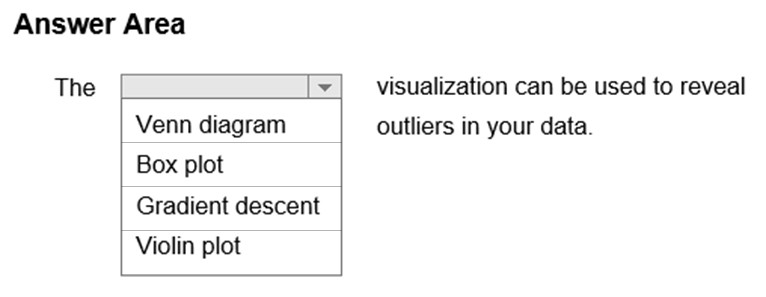
The box-plot algorithm can be used to display outliers. Reference: https://medium.com/analytics-vidhya/what-is-an-outliers-how-to-detect-and-remove-them-which-algorithm-are-sensitive-towards-outliers-2d501993d59
The dots in a boxplot visualize the outliers.
So boxplot is correct.
upvoted 1 times
...
This section is not available anymore. Please use the main Exam Page.DP-100 Exam Questions
Log in to ExamTopics
Sign in:
Community vote distribution
A (35%)
C (25%)
B (20%)
Other
Most Voted
A voting comment increases the vote count for the chosen answer by one.
Upvoting a comment with a selected answer will also increase the vote count towards that answer by one.
So if you see a comment that you already agree with, you can upvote it instead of posting a new comment.


Learner_Thunder2
Highly Voted 2 years, 11 months agoGabonia
2 years, 3 months agoTin_Tin
Most Recent 11 months, 3 weeks agoPradhanManva
1 year, 2 months agoclark88
1 year, 11 months ago