DRAG DROP -
A call center manager monitors incoming phone calls. The manager analyzes the performance of phone reps by using a custom view. The view contains a custom field named Phone call Duration in Minutes.
The call center manager must present an Excel spreadsheet daily to upper management. The spreadsheet must contain the call center performance for further trending analysis and corrective actions.
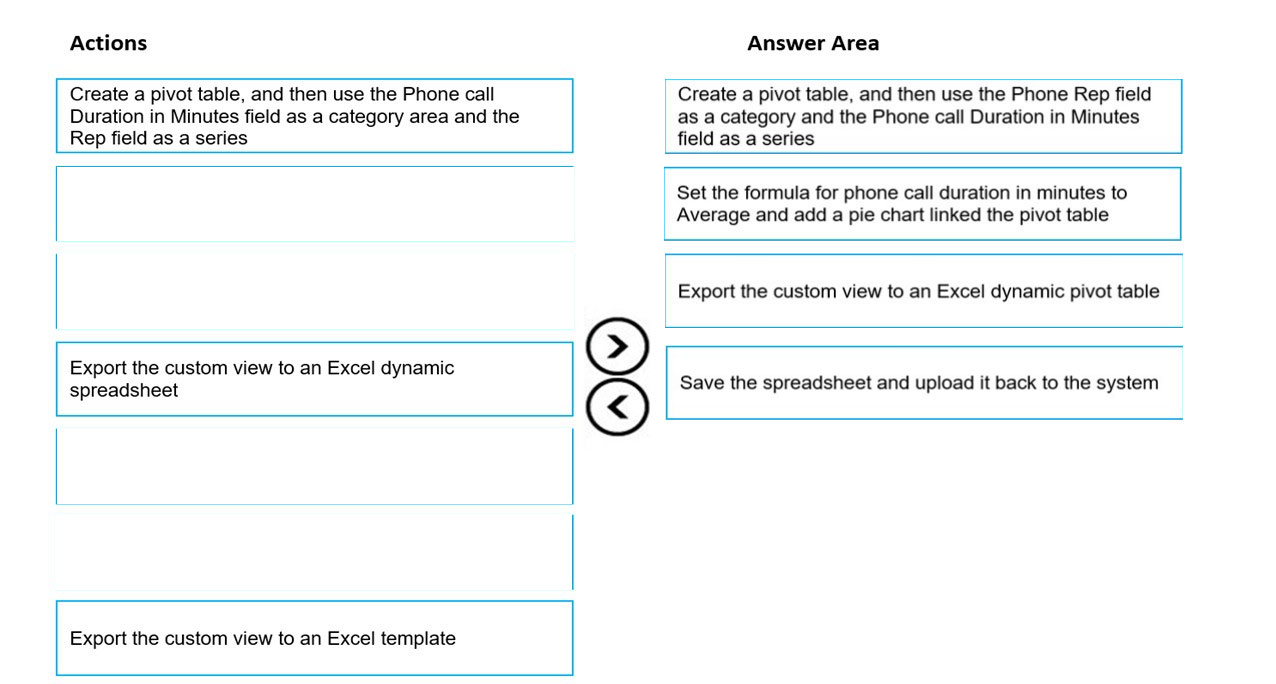
You need to create the spreadsheet.
Which four actions should you perform in sequence? To answer, move the appropriate actions from the list of actions to the answer area and arrange them in the correct order.
Select and Place: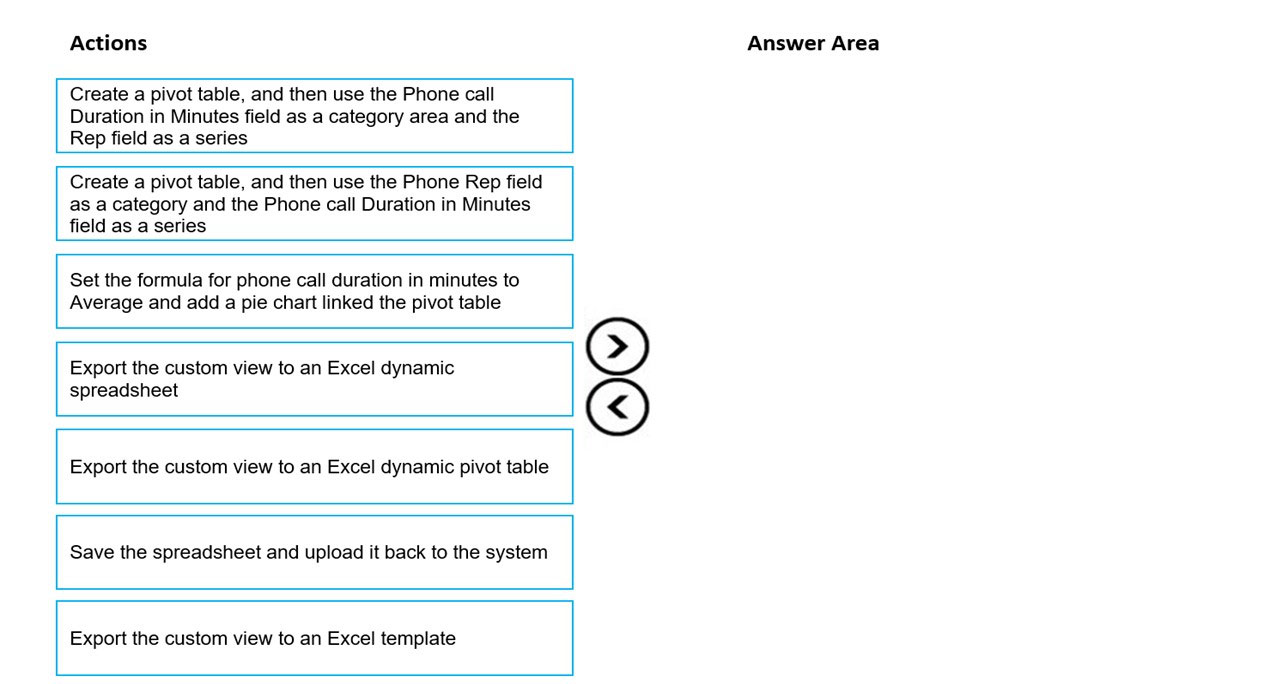

RazielLycas
Highly Voted 2 years, 9 months agoSashM
Highly Voted 3 years, 6 months agocharles879987
Most Recent 2 years, 5 months agocharles879987
2 years, 5 months agoW2S3
2 years, 7 months agoryanzombie
2 years, 9 months agotimothy123
2 years, 7 months agosixeasypayments
3 years, 7 months ago