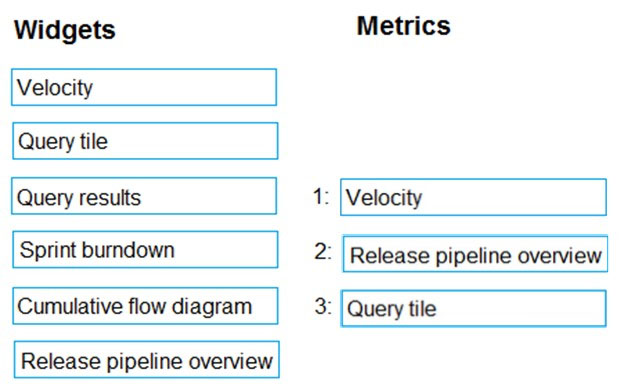
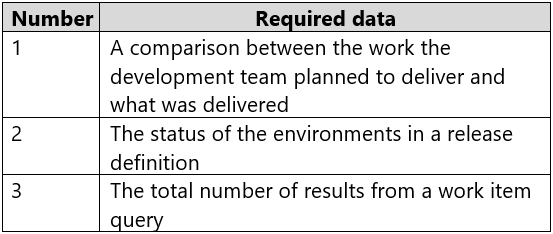
DRAG DROP -
You are configuring the Azure DevOps dashboard. The solution must meet the technical requirements.
Which widget should you use for each metric? To answer, drag the appropriate widgets to the correct metrics. Each widget may be used once, more than once, or not at all. You may need to drag the split bar between panes or scroll to view content.
NOTE: Each correct selection is worth one point.
Select and Place: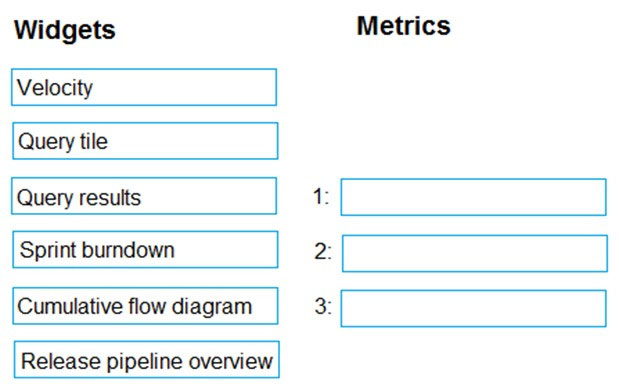


lglars
Highly Voted 3 years agoRanzzzan
2 years, 5 months ago60ties
1 year, 1 month agopdk88
2 years, 11 months agopdk88
2 years, 10 months agoxRiot007
2 years agoInland
Highly Voted 3 years, 1 month agokennynelcon
3 years agoDankho
Most Recent 7 months, 2 weeks agoMo_alwaysjolling
5 months, 3 weeks agovsvaid
1 year, 7 months agoKingTN
1 year, 11 months agoLindyLou
2 years agoPamban
2 years, 1 month agoajaykjl
2 years, 7 months agoxRiot007
2 years agoAtos
2 years, 10 months agopamswam
2 years, 11 months agopdk88
2 years, 10 months agoVladanO
2 years, 11 months agosyu31svc
2 years, 11 months agoMohmmadFayez
2 years, 11 months agogiuliohome
2 years, 11 months agoakp1000
3 years agoJan91
3 years, 2 months agovupham2909
3 years, 3 months ago