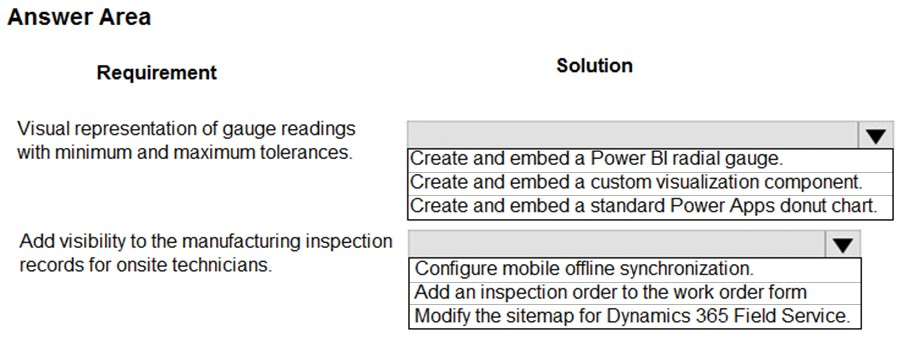
HOTSPOT - You need to recommend a solution to meet user interface requirements. What should you recommend? To answer, select the appropriate options in the answer area. NOTE: Each correct selection is worth one point. Hot Area:
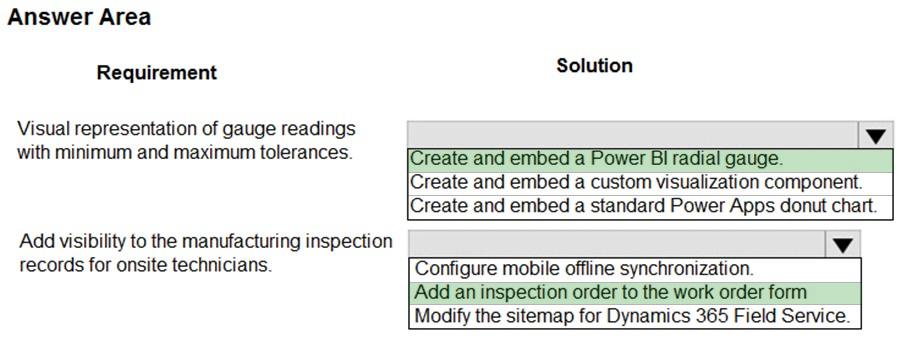
Suggested Answer:
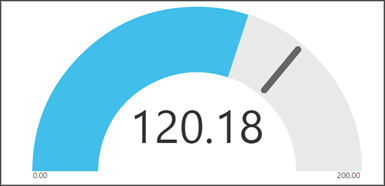
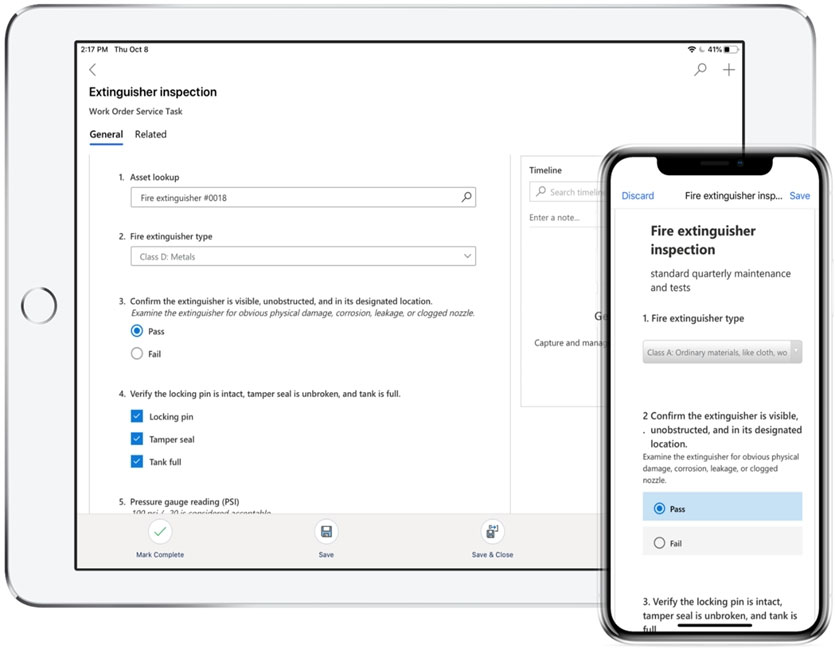
Box 1: Create and embed a Power Bi radial gauge A radial gauge chart has a circular arc and shows a single value that measures progress toward a goal or a Key Performance Indicator (KPI). The line (or needle) represents the goal or target value. The shading represents the progress toward that goal. The value inside the arc represents the progress value. Power BI spreads all possible values evenly along the arc, from the minimum (left-most value) to the maximum (right-most value). In this example, you're a car retailer tracking the sales team's average sales per month. The needle represents a 140 cars sales goal. The minimum possible average sales is 0 and the maximum is 200. The blue shading shows that the team is averaging approximately 120 sales this month. Box 2: Add an inspection order to the work order form You can add inspections to work orders in Dynamics 365 Field Service. Field Service inspections are digital forms that technicians use to quickly and easily answer a list of questions as part of a work order. The list of questions can include safety protocols, pass-and-fail tests for a customer asset, an interview with a customer, or other audits and assessments performed before, during, or after a work order. Example: Reference: https://docs.microsoft.com/en-us/power-bi/visuals/power-bi-visualization-radial-gauge-charts https://docs.microsoft.com/en-us/dynamics365/field-service/inspections
Question 1: Power BI - The reason is because the values need to be customizable by the inspectors (instantly removes custom from being correct). The Power Apps donut chart would be for looking at multiple records (which in this scenario, we are not).
Question 2: Modify the Sitemap - The trick is the question is asking about viewing recordS. Adding a form to a form would give technicians the ability to see more information about a single inspection, from a single machine record. A valid business ask but is not what the question here is about. Offline sync is unrelated and can be excluded because users are onsite.
The radial gauge can be configured with min/max tolerances. What part of the requirement don't you think it meets?
upvoted 4 times
...
...
This section is not available anymore. Please use the main Exam Page.PL-600 Exam Questions
Log in to ExamTopics
Sign in:
Community vote distribution
A (35%)
C (25%)
B (20%)
Other
Most Voted
A voting comment increases the vote count for the chosen answer by one.
Upvoting a comment with a selected answer will also increase the vote count towards that answer by one.
So if you see a comment that you already agree with, you can upvote it instead of posting a new comment.

ClairFraser
Highly Voted 2 years, 11 months agoWASSIM2020
7 months agoGrif53
Most Recent 11 months agoNewb007
2 years, 3 months agoRobert1
2 years, 2 months agoRobert1
2 years, 2 months agoMrWood47
2 years, 5 months agoBrettusMaximus
3 years agoIcky
3 years agobingomutant
3 years, 2 months agoIcky
3 years ago