DRAG DROP -
You are using the Dependency Tracker extension in a project in Azure DevOps.
You generate a risk graph for the project.
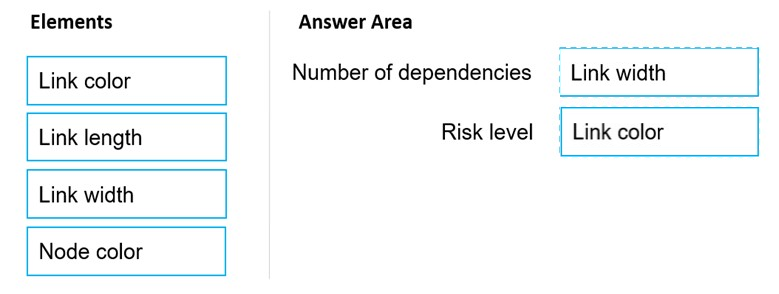
What should you use in the risk graph to identify the number of dependencies and the risk level of the project? To answer, drag the appropriate elements to the correct data points. Each element may be used once, more than once, or not at all. You may need to drag the split bar between panes or scroll to view content.
NOTE: Each correct selection is worth one point.
Select and Place: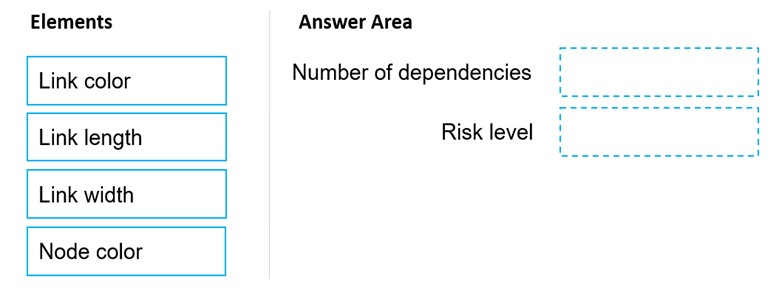

zellck
Highly Voted 1 year agoyana_b
Most Recent 10 months agoRonZhong
1 year, 1 month agofkaracan
1 year, 3 months agofkaracan
1 year, 3 months agomarkp
1 year, 8 months agopdk88
1 year, 8 months agosyu31svc
1 year, 9 months ago