DRAG DROP -
You receive revenue data that must be included in Microsoft Power BI reports.
You preview the data from a Microsoft Excel source in Power Query as shown in the following exhibit.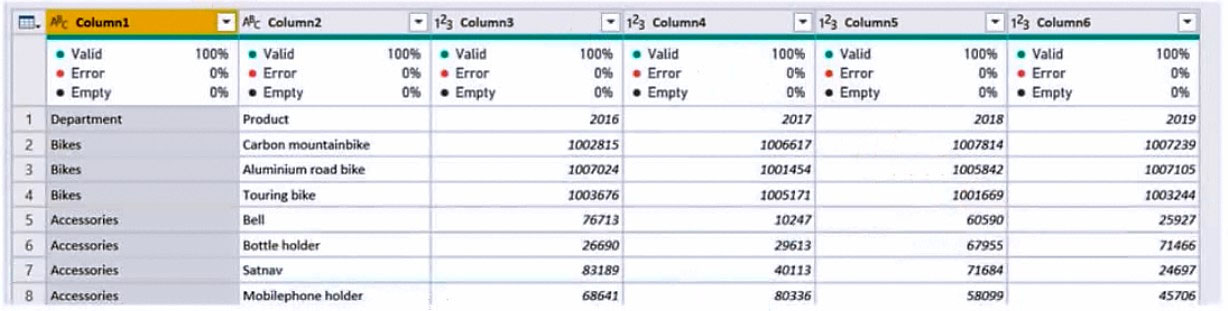
You plan to create several visuals from the data, including a visual that shows revenue split by year and product.
You need to transform the data to ensure that you can build the visuals. The solution must ensure that the columns are named appropriately for the data that they contain.
Which three actions should you perform in sequence? To answer, move the appropriate actions from the list of actions to the answer area and arrange them in the correct order.
Select and Place: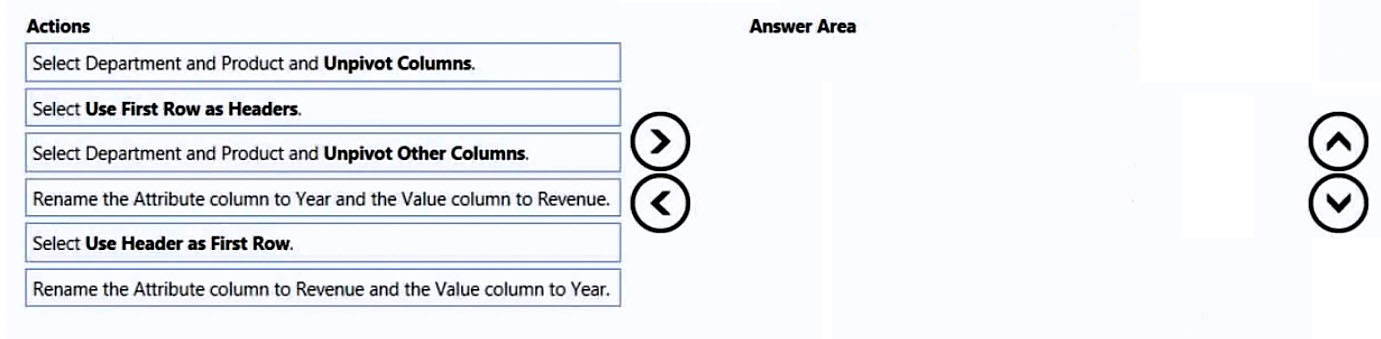


ajlanemed
Highly Voted 2 years, 11 months ago627628c
6 months, 3 weeks agoMfmx2024
8 months agoSylUK
6 months, 2 weeks agooogrio
2 years, 5 months agoolajor
2 years, 10 months agoj0gam0d
Highly Voted 2 years, 10 months agoKMS111
1 year, 2 months agoInesd
1 year, 2 months agoAmont1
2 years, 2 months agoLulu_2022
Most Recent 3 weeks, 4 days agoimenjmal9
6 months, 2 weeks agojaume
8 months, 2 weeks agonelrosell
11 months, 2 weeks agorcaliandro
11 months, 3 weeks ago00c7ee4
11 months, 3 weeks ago9f73003
1 year, 3 months agoDani_eL
1 year, 5 months agomycorgiart
10 months, 4 weeks agoKKPanda77
1 year, 5 months agonelrosell
11 months, 2 weeks agoRhugved
1 year, 5 months ago__Sai_Mounika__
1 year, 6 months agoStayhardson
1 year, 6 months agoeuchrid
1 year, 8 months agocs3122
1 year, 6 months agocokimon
1 year, 8 months agoacvribeiro
1 year, 9 months agoT1M2P
1 year, 9 months ago