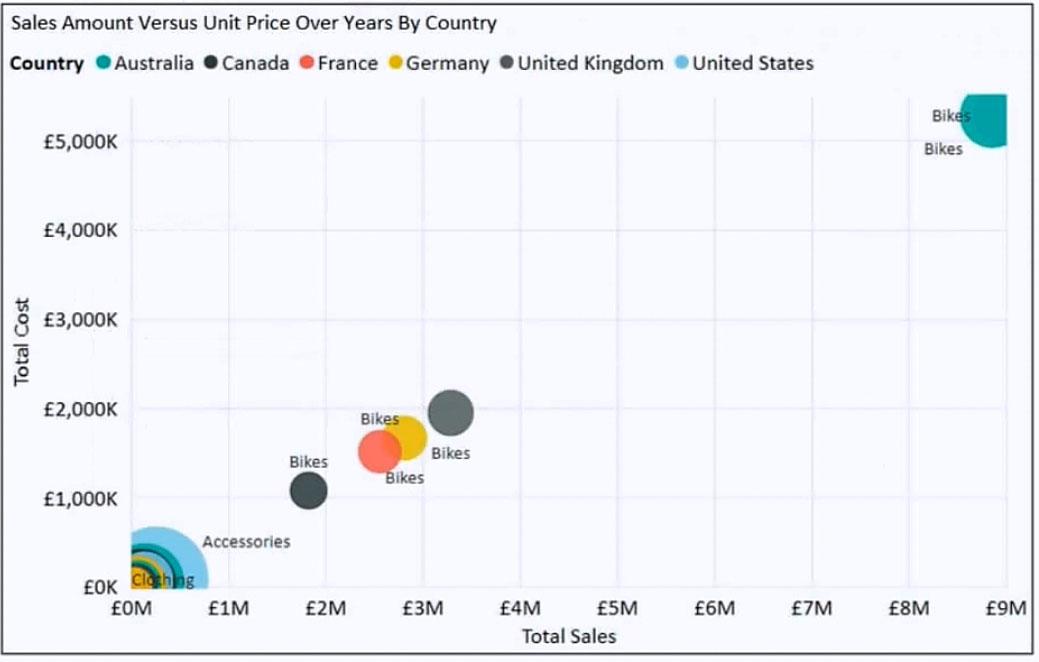
You have the visual shown in the exhibit. (Click the Exhibit tab.) You need to show the relationship between Total Cost and Total Sales over time. What should you do?
A.
Add a play axis.
B.
From the Analytics pane, add an Average line.
C.
Add a slicer for the year.
D.
Create a DAX measure that calculates year-over-year growth.
This is the optimal answer but I think option C would also work. Only difference between A and C options is to walk through the years manually or let PBI do that walk automatically
It would be A. A Play Axis works like a Dynamic slicer. Also see shakes103's comment:
"Both scatter and bubble charts can also have a play axis, which can show changes over time".
https://learn.microsoft.com/en-us/power-bi/visuals/power-bi-visualization-types-for-reports-and-q-and-a#scatter-bubble-and-dot-plot-chart
There was an exercise in the PL-300 self learning path where the scope was to build such a visual and finally setup the Play Axis. Seeing that visual here,… no question asked, it is the Play Axis
I think that the answer is C, because this is the most complete answer. It specifies also on which field the slicer must be based.
The Play Axis is actually also a slicer that plays automatically. Only with this option isn't specified on which field the Play Axis should be based, so the answer is not complete.
Another thing is that the Play Axis must be purchased as a custom visual and is not part of the basic set of Power BI visuals.
You are absolutely correct. I would go for C.
Another point to note is that is that you have to download the play axis separately, it is not in the default visual icons. So, I would go for C.
"Both scatter and bubble charts can also have a play axis, which can show changes over time".
https://learn.microsoft.com/en-us/power-bi/visuals/power-bi-visualization-types-for-reports-and-q-and-a#scatter-bubble-and-dot-plot-chart
upvoted 6 times
...
...
This section is not available anymore. Please use the main Exam Page.PL-300 Exam Questions
Log in to ExamTopics
Sign in:
Community vote distribution
A (35%)
C (25%)
B (20%)
Other
Most Voted
A voting comment increases the vote count for the chosen answer by one.
Upvoting a comment with a selected answer will also increase the vote count towards that answer by one.
So if you see a comment that you already agree with, you can upvote it instead of posting a new comment.

Mongwadi
Highly Voted 2 years, 9 months agoLeeTheRed
Highly Voted 1 year, 6 months agoLuisViotti
Most Recent 1 month, 2 weeks agojaume
7 months agorcaliandro
10 months, 1 week agoPalwashai
1 year agoDani_eL
1 year, 3 months agoDsbuff
1 year, 5 months agopepix74
2 years, 2 months agoHoeishetmogelijk
2 years, 6 months agoiccent2
2 years, 6 months agoolgix
1 year, 9 months agolukelin08
2 years, 6 months agosusunz
2 years, 7 months agofdsdfgxcvbdsfhshfg
2 years, 9 months agoJune15
2 years, 9 months agoemmanuelkech
2 years, 9 months agoshakes103
2 years, 7 months ago