HOTSPOT -
You have a report in Power BI Desktop.
You add a key influencers visual as shown in the exhibit. (Click the Exhibit tab.)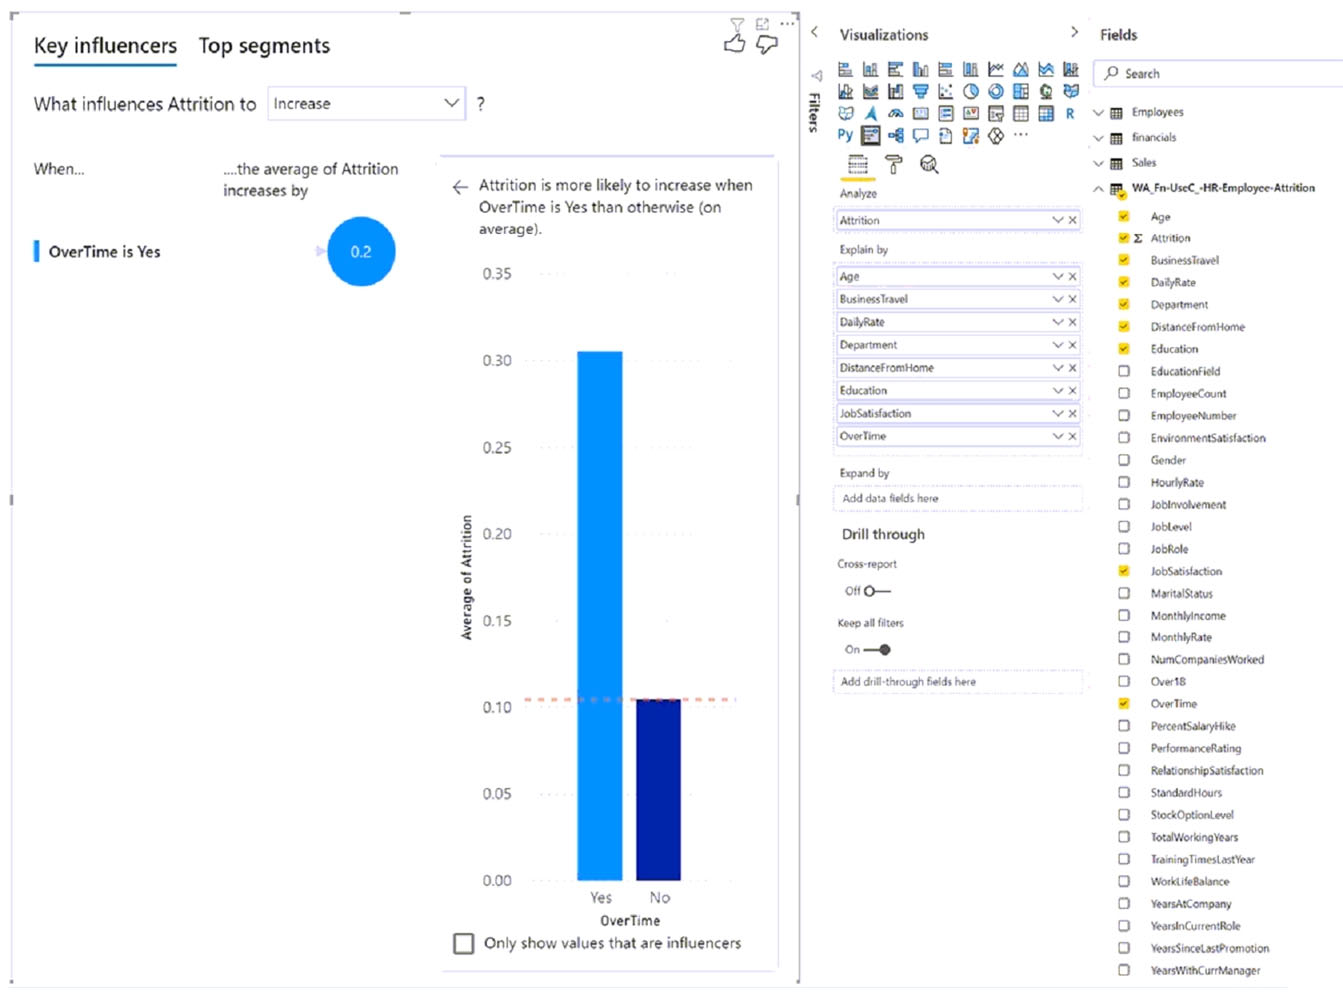
Use the drop-down menus to select the answer choice that completes each statement based on the information presented in the graphic.
NOTE: Each correct selection is worth one point.
Hot Area: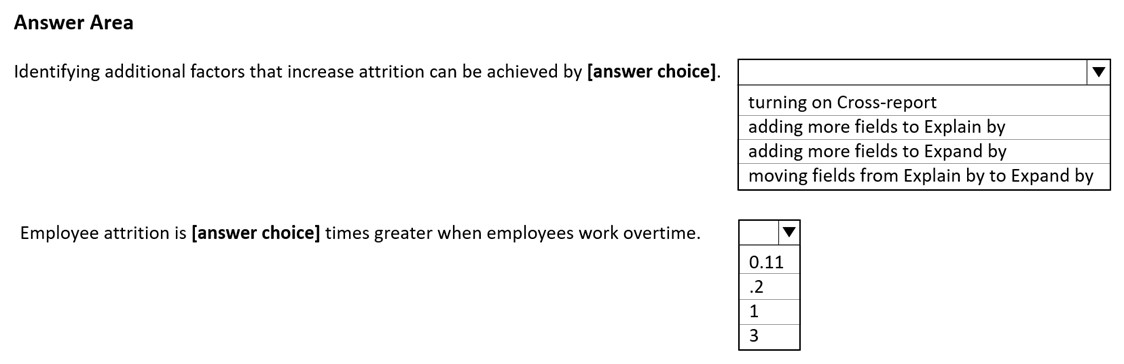


Manikom
Highly Voted 2 years, 10 months agodesibaby09
8 months agoShalaleh
2 years, 4 months agoRicoPallazzo7
1 year, 9 months agocentrumadresowe
Highly Voted 2 years, 9 months agosemauni
2 years, 3 months agosemauni
2 years, 3 months agoSylUK
Most Recent 5 months, 1 week ago539d541
11 months, 1 week agorcaliandro
11 months, 2 weeks ago0e18c76
1 year, 3 months agouser28272615
1 year, 5 months agobenni_ale
1 year, 6 months agoshuchi9
1 year, 7 months agoParv_2903
1 year, 6 months agoKokS24
1 year, 8 months agothomas_90
1 year, 10 months agomadyjoe21
1 year, 10 months agoIgetmyrole
1 year, 10 months agoSamuComqi
2 years agoAY_Seyi
2 years, 1 month agoAyoJose
1 year, 10 months agoUlyUkr
2 years, 2 months agoRazaTheLegend
2 years, 3 months ago