HOTSPOT -
You are profiling data by using Power Query Editor.
You have a table named Reports that contains a column named State. The distribution and quality data metrics for the data in State is shown in the following exhibit.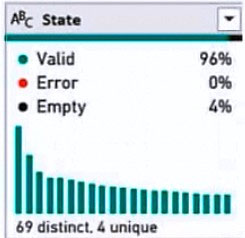
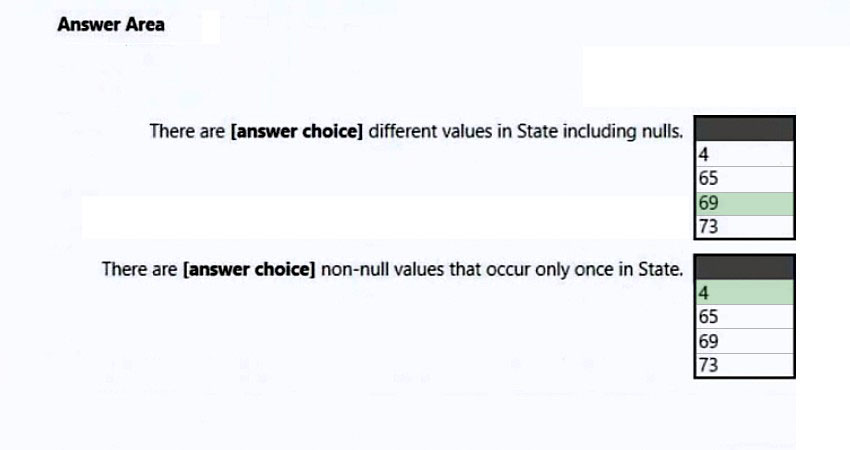
Use the drop-down menus to select the answer choice that completes each statement based on the information presented in the graphic.
NOTE: Each correct selection is worth one point.
Hot Area: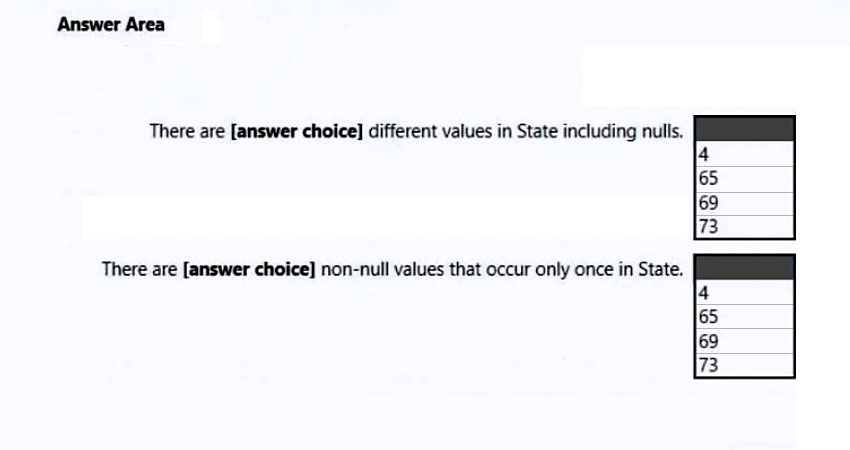

olajor
Highly Voted 2 years, 9 months agologanzz
10 months, 1 week agoyaguitoEC
1 year, 11 months agolearnazureportal
Highly Voted 2 years, 9 months agoBP215
Most Recent 1 month, 2 weeks agopavanmanideep
4 months agoddd29291998
9 months agorcaliandro
10 months, 1 week agorcaliandro
10 months, 1 week agoCaptainSappy11
1 year, 1 month agosm222
1 year, 2 months agoshulaijia
1 year, 3 months agoTrustMyAnswers
1 year, 7 months agothomas_90
1 year, 8 months agoSaiCharan534
1 year, 9 months agoIgetmyrole
1 year, 9 months agon_uttam28
1 year, 10 months agomadyjoe21
1 year, 10 months agoBamlaku
1 year, 10 months agoXtophine
1 year, 9 months agopowerbot9000
1 year, 4 months agomustafaalhnuty
1 year, 10 months agoET_phone_home_son
1 year, 11 months ago