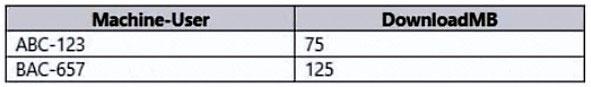
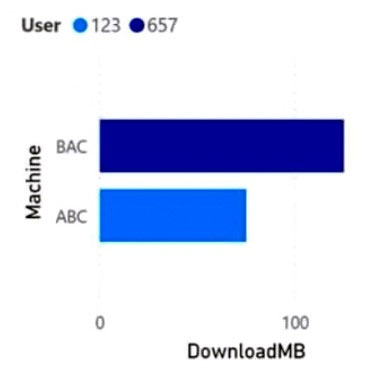
You are building a data model for a Power BI report. You have data formatted as shown in the following table. You need to create a clustered bar chart as shown in the following exhibit. What should you do?
A.
From Power Query Editor, split the Machine-User column by using a delimiter.
B.
From Power Query Editor, create a column that contains the last three digits of the Machine-User column.
C.
In a DAX function, create two calculated columns named Machine and User by using the SUBSTITUTE function.
D.
In a DAX function, create two measures named Machine and User by using the SUBSTITUTE function.
Agree with A.
Only reason I had for not using B was that we may not be able to guarantee a length of 3 char.
Has anyone else got a reason for not choosing B?
Its wrong if you split the column at Powerquery the name of the columns dont split then we need the name to make the legend and the y labels so the correct choice is C
we use SUBSTITUE function for: Replaces existing text with new text in a text string.
but here we do not want replace something, we want split the column by the delimiter "-"
If we split the column, we might never be able to use the original. Also, the question does not say to maintain the model size. So the best answer should be B.
A is the correct answer.
This action will allow us to split the combined "Machine-User" values into separate columns for "Machine" and "User", which is for creating a clustered bar chart with the desired X and Y-axis values.
Answer is A is the best and fastest solution. Splitting the column into 2 is better that creating an extra 2 calculated columns, this will increase the model size.
The desired visual is provided. However, the dataset shown contains a column where machine and user data from the visual are combined into 1 column. Therefore, to solve this you need to use a delimiter. This will split one column into two, where you will use Machine column (BAC & ABC) as your Y-axis and User column (123 & 657) as your legend.
The desired visual is provided. However, the dataset shown contains a column where machine and user data from the visual are combined into 1 column. Therefore, to solve this you need to use a delimiter. This will split one column into two, where you will use Machine column (BAC & ABC) as your Y-axis and User column (123 & 657) as your legend.
This section is not available anymore. Please use the main Exam Page.PL-300 Exam Questions
Log in to ExamTopics
Sign in:
Community vote distribution
A (35%)
C (25%)
B (20%)
Other
Most Voted
A voting comment increases the vote count for the chosen answer by one.
Upvoting a comment with a selected answer will also increase the vote count towards that answer by one.
So if you see a comment that you already agree with, you can upvote it instead of posting a new comment.

Namenick10
Highly Voted 2 years, 9 months ago1CY1
9 months, 2 weeks agonevesrf
2 years, 4 months agoShalaleh
2 years, 3 months agoShalaleh
2 years, 3 months agoSamuComqi
Highly Voted 1 year, 11 months agoMoxieTT
1 year, 11 months agoAdrianBalescu
1 year, 6 months agoFra04
1 year, 4 months agodesibaby09
Most Recent 6 months, 3 weeks agojaume
7 months, 2 weeks agorcaliandro
10 months, 3 weeks agoDsbuff
1 year, 6 months agoSandeep_kumar_yadav
1 year, 7 months agolcss27
1 year, 9 months agoIgetmyrole
1 year, 10 months agoMoxieTT
1 year, 11 months agoShalaleh
2 years, 2 months agoUlyUkr
2 years, 2 months agoRazaTheLegend
2 years, 2 months agoShaziq
2 years, 6 months agonaomilena
2 years, 5 months agojboiret
2 years, 6 months agocsillag
2 years, 6 months agoPatrick666
2 years, 7 months ago