HOTSPOT -
You have a table that contains the following three columns:
City -
✑ Total Sales
✑ Occupation
You need to create a key influencers visualization as shown in the exhibit. (Click the Exhibit tab.)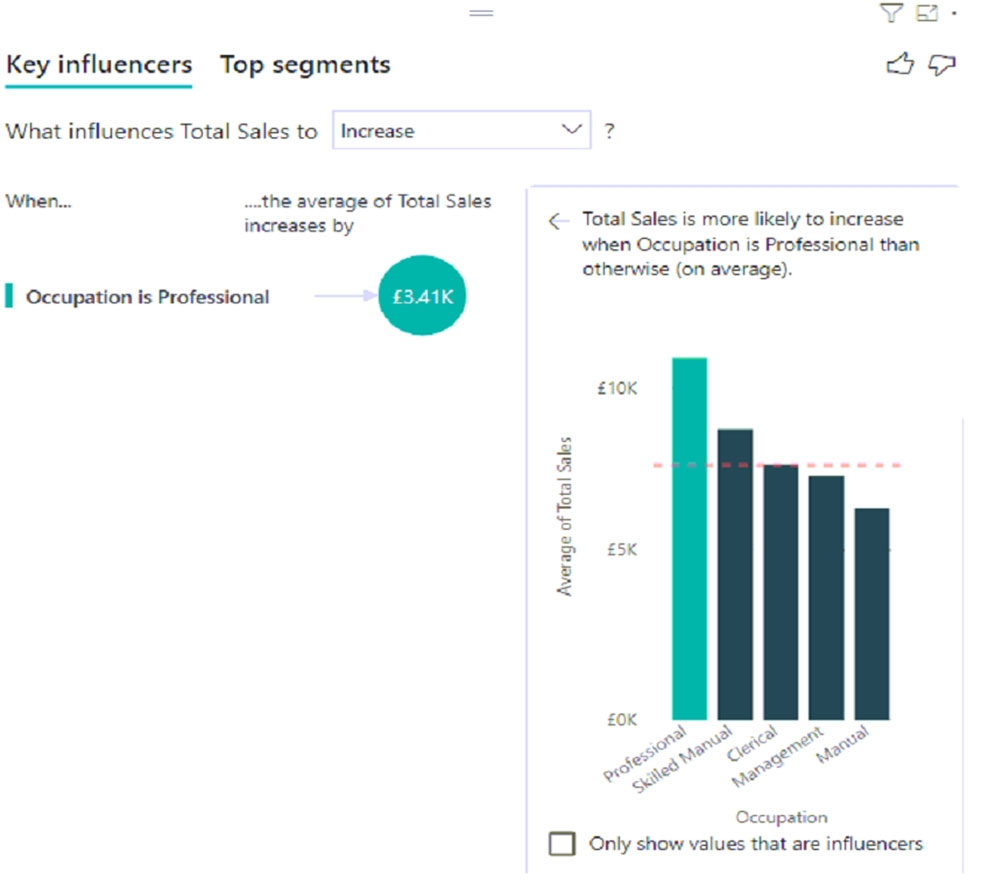
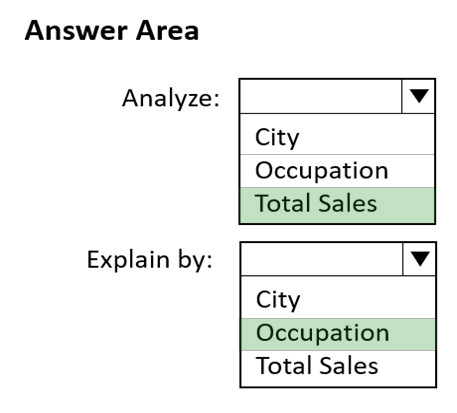
How should you configure the visualization? To answer, select the appropriate options in the answer area.
NOTE: Each correct selection is worth one point.
Hot Area: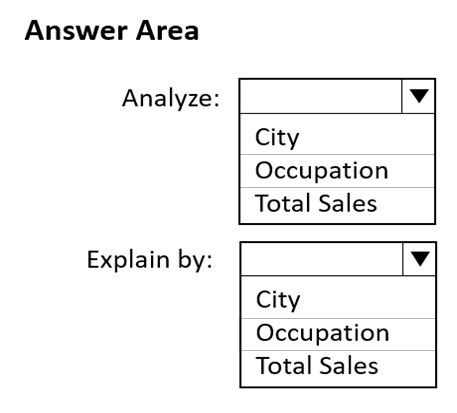

centrumadresowe
Highly Voted 2 years, 7 months agolukelin08
Highly Voted 2 years, 8 months agoLuluSkyy
Most Recent 7 months, 1 week agorcaliandro
9 months, 3 weeks agoshahrzadkhb
11 months, 3 weeks agoPalwashai
12 months agob7c21a9
1 year, 2 months agogeorgian4344
1 year, 2 months ago08b2ddd
1 year, 5 months agoIgetmyrole
1 year, 9 months agoMoxieTT
1 year, 11 months agobaraSIR
2 years, 1 month agoRazaTheLegend
2 years, 1 month agoPatrick666
2 years, 6 months agoSunny_008
2 years, 8 months ago