HOTSPOT -
You are profiling data by using Power Query Editor.
You have a table that contains a column named column1. Column statistics and Value distribution for column1 are shown in the following exhibit.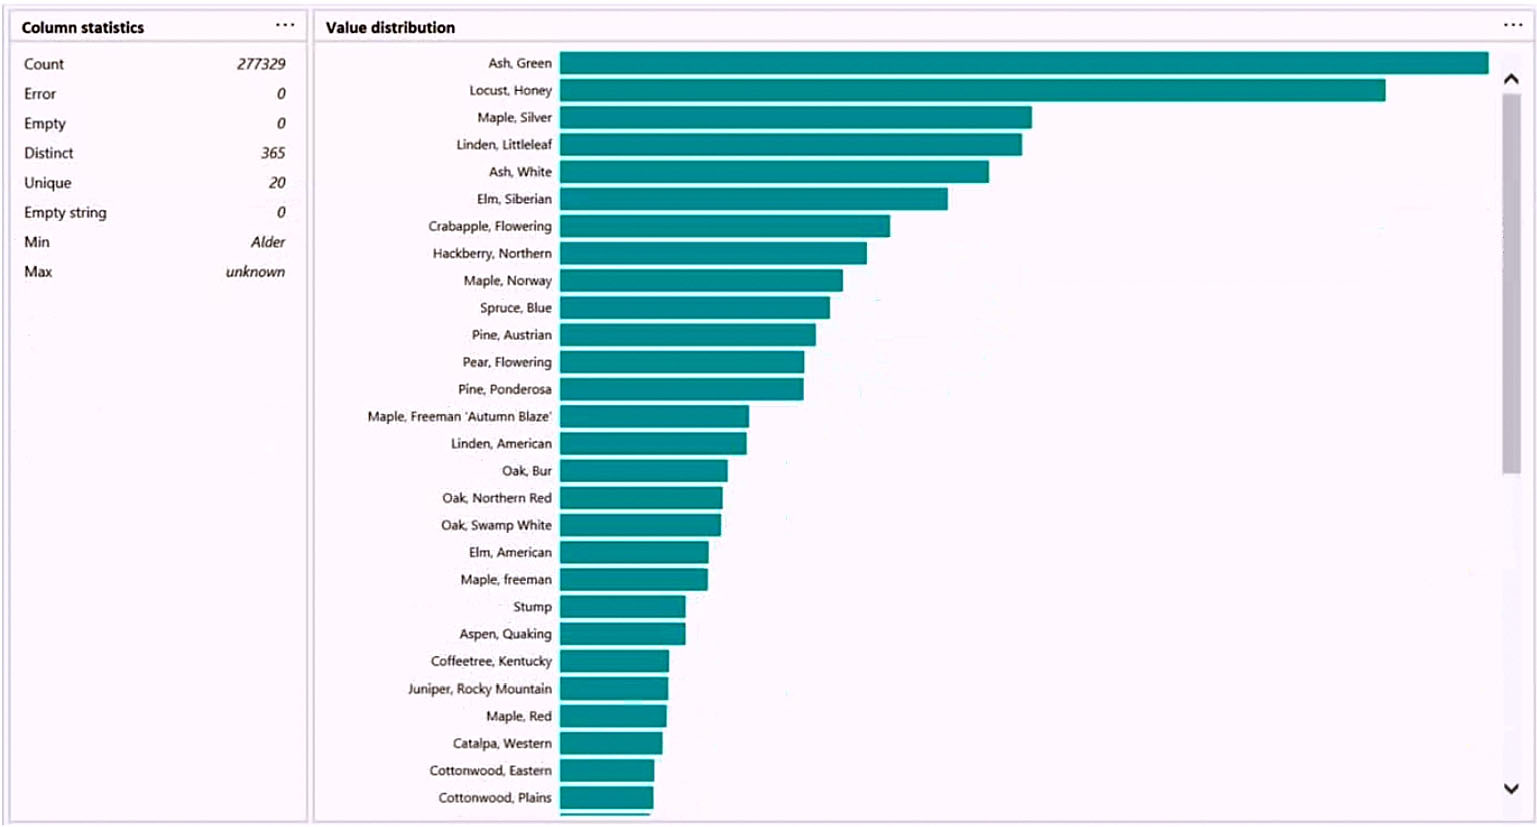
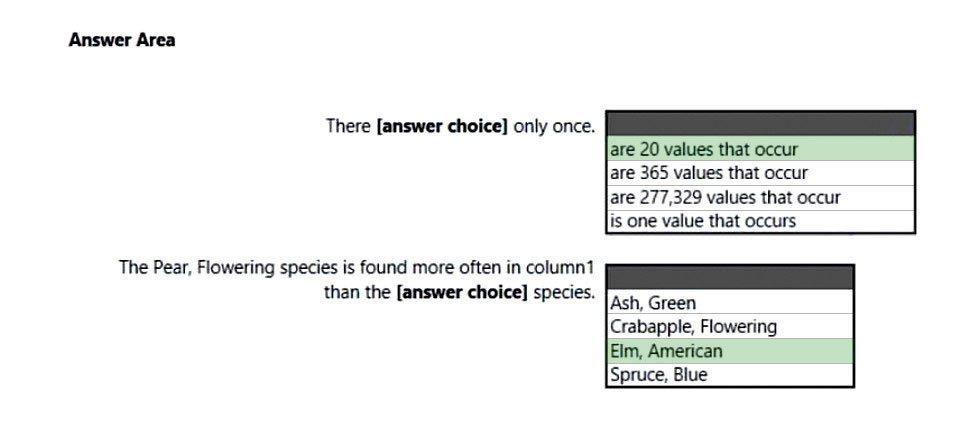
Use the drop-down menus to select the answer choice that completes each statement based on the information presented in the graphic.
NOTE: Each correct selection is worth one point.
Hot Area: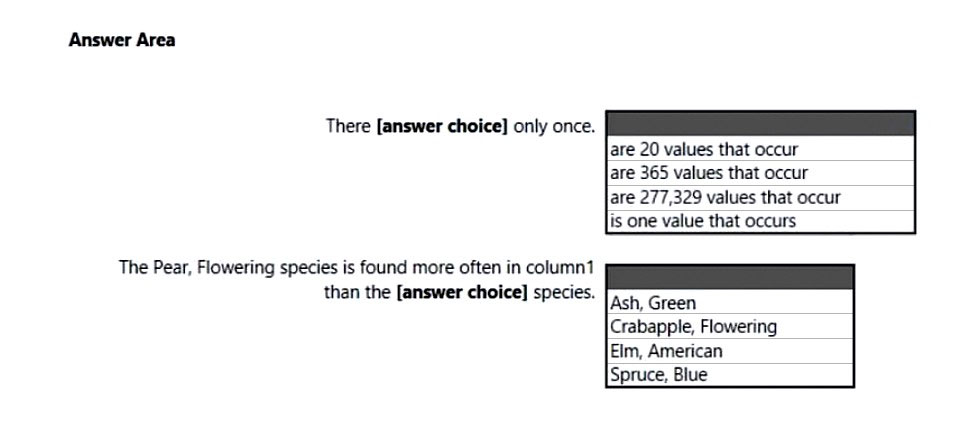

INDEAVR
Highly Voted 2 years, 9 months agoMati_123
Highly Voted 2 years, 4 months ago1CY1
10 months, 2 weeks agojaume
Most Recent 8 months, 2 weeks agorcaliandro
11 months, 2 weeks agoInesd
1 year, 2 months agob7c21a9
1 year, 4 months agocs3122
1 year, 6 months agoLeeTheRed
1 year, 7 months agoDiogo1998
1 year, 7 months agoSamuComqi
2 years agosdaaram
2 years agoMoxieTT
2 years agoShalaleh
2 years, 3 months agoyoussef_yt89
2 years, 5 months agoJejemon
2 years, 7 months agocsillag
2 years, 7 months agoRickson
2 years, 8 months agolukelin08
2 years, 8 months ago