DRAG DROP -
You create a new workbook and add a table to a data model. The data is shown in the following table.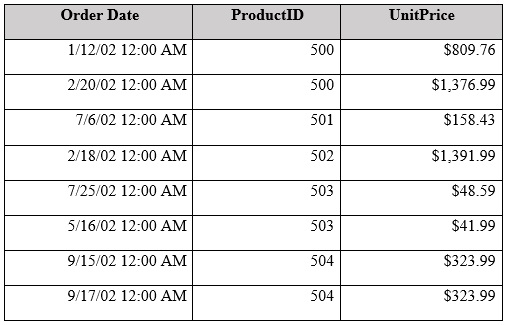
You need to create a visualization as shown in the following exhibit.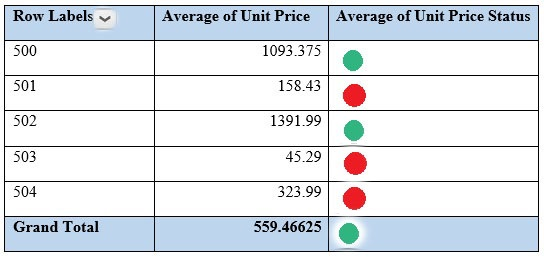
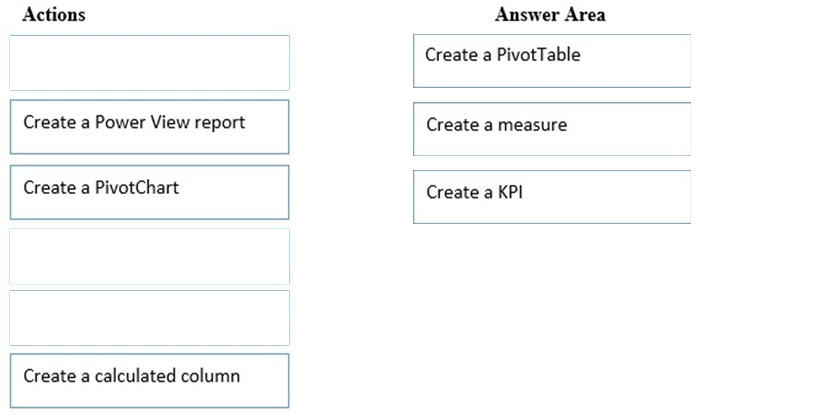
Which three actions should you perform in sequence? To answer, move the appropriate actions from the list of actions to the answer area and arrange them in the correct order.
Select and Place: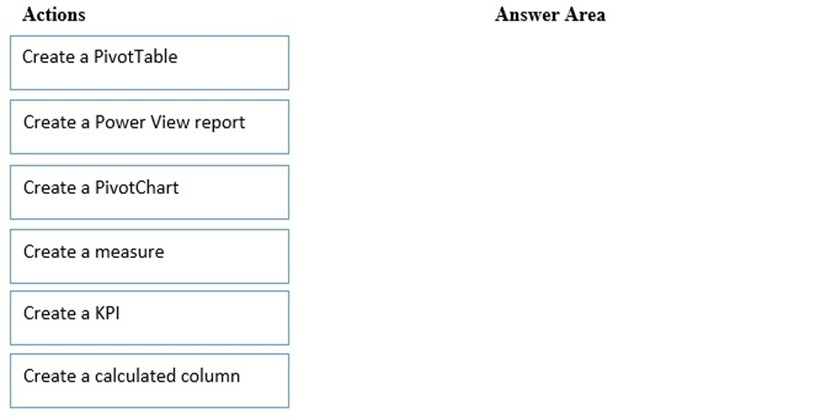

Addabea
Highly Voted 5 years, 3 months ago123
4 years, 11 months agofrances22999
4 years, 5 months agotho
Highly Voted 5 years, 5 months agocubo
5 years, 5 months agoCDL
Most Recent 4 years, 7 months agokimalto452
4 years, 7 months agoPowerBIconsultant12
4 years, 6 months agolyniguez
4 years, 7 months agoWaltmas
4 years, 9 months agor8d1
4 years, 9 months agofrances22999
4 years, 5 months agoOutsider
4 years, 10 months agoAzeez1
4 years, 11 months agoAzeez1
4 years, 11 months ago