Expert Verified, Online, Free.
A marketing analyst assessed the effect of web page design (A, B, or C) on customers' intent to purchase an expensive product. The focus group was divided randomly into three sub-groups, each of which was asked to view one of the web pages and then give their intent to purchase on a scale from 0 to 100. The analyst also asked the customers to give their income, which was coded as: I (lowest), II (medium), or III (highest). After analyzing the data, the analyst claimed that there was significant interaction and the webpage design mainly influenced high income people.
Which graph supports the analyst's conclusion?
A.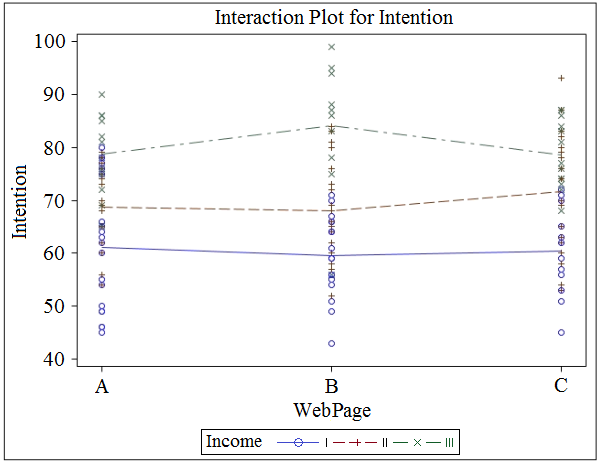
B.
C.
D.
PerkDizzzle
3 years, 6 months agododoeum
3 years, 6 months ago